kubernetes-microservices
Chapter 01 - Introduction
Lecture 001 - Welcome
Lecture 002 - What you should know
Lecture 003 - Exercise files
Chapter 02 - Introduction to Microservices
Lecture 004 - Microservices 101
Microservices
- In the dev world, one of the most popular buzz words is microservices.
- Almost everyone, from developers and large enterprises to startups, are talking about microservices.
- If you're new to the ecosystem, think of microservices as a variant of service-oriented architecture that structures the entire application as a collection of loosely coupled services.
Benefits
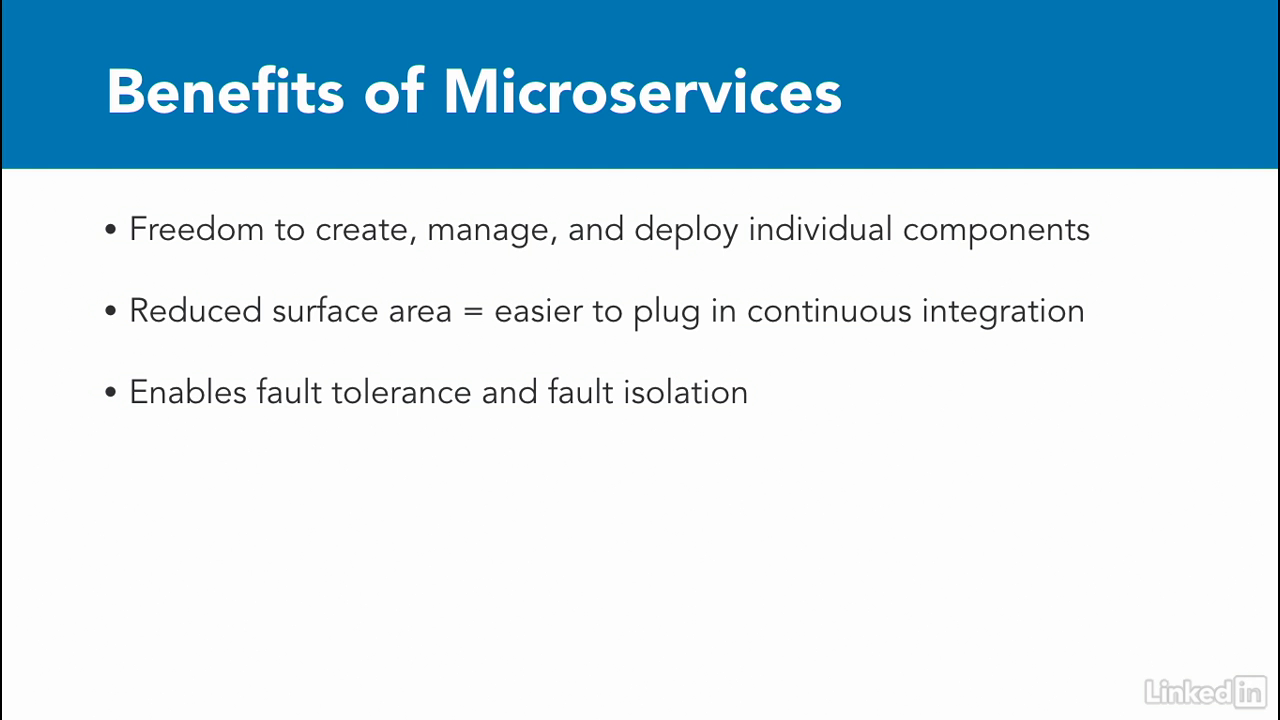
- From a high level, using a microservice architecture has many benefits.
- First, by breaking up a monolithic service into many smaller, independent services that work together, developers have more freedom to create, manage, and deploy the individual components without compromising the integrity of the entire application.
- Because the surface area of each individual service is smaller, it's easier to plug in this approach into a continuous integration pipeline.
- Which enables continuous delivery.
- Microservices allow for a more resilient application over all.
- If one service fails, the whole application shouldn't fail hard and other components should still continue to work.
- This allows you to isolate faults in a better manner and make your overall application more fault tolerant.
Microservices
- Typically, microservices are broken up with the intent to solve a specific business need or enable a business capability.
- The structure makes it easier to build services that can be clearly communicated to the business side of the organization.
Microservices
- In my experience within large orgs, it's always been easier to justify technical work when it relates directly to a specific business need, as opposed to a generic code refactor.
- It helps us build a common language with our business counterparts.
Microservices
- From the sounds of it, microservices seem pretty rosy.
- But is that necessarily the case?
Microservices
- Like a lot of other questions in software, the right answer is - it depends.
- There's a lot of data on whether to choose a microservice versus a monolithic architecture.
- But I like the practical approach in the Martin Fowler blog article.
- He recommends using a microservice pattern to build larger complicated applications but a monolithic platform for simpler apps is still acceptable.
Microservices vs monolith
- For greenfield opportunities, there's an initial learning curve and many additional facets to set up with microservices that you won't encounter with monoliths.
- As you continue development you start to build a more complex system.
- During this process, you'll need more organizational knowledge of the inner workings of the monolith.
- This is different in microservices architecture, where you'll need to know less upfront.
- Later, when you have a rather large codebase or larger teams, Conway's Law kicks in and you end up mimicking the structure of your organization in your codebase.
- Chances are, you'll end up being more productive using the microservice architecture, rather than trying to add features or debug a large monolith.
- Thus, if you started with a microservice architecture up front, you'll end up seeing rewards later on in the lifecycle of the application.

Building microservices
- One of the lessons I've learned, by building microservices for many years now, is that I always think of applications in a modular way.
- You can certainly build applications in this way even if you're building a monolith, but you inherently end up paying more attention to how to keep your code modular by using a microservices approach.
About this course
- We'll spend the majority of time, in this course, looking at common microservices patterns and architectures.
- And see how these fit into the Kubernetes environment.
- My hope is that, by the end of the course, you can build out large microservices based applications using Kubernetes as your microservices platform.
Lecture 005 - Benefits of a microservices architecture
Section

Benefits
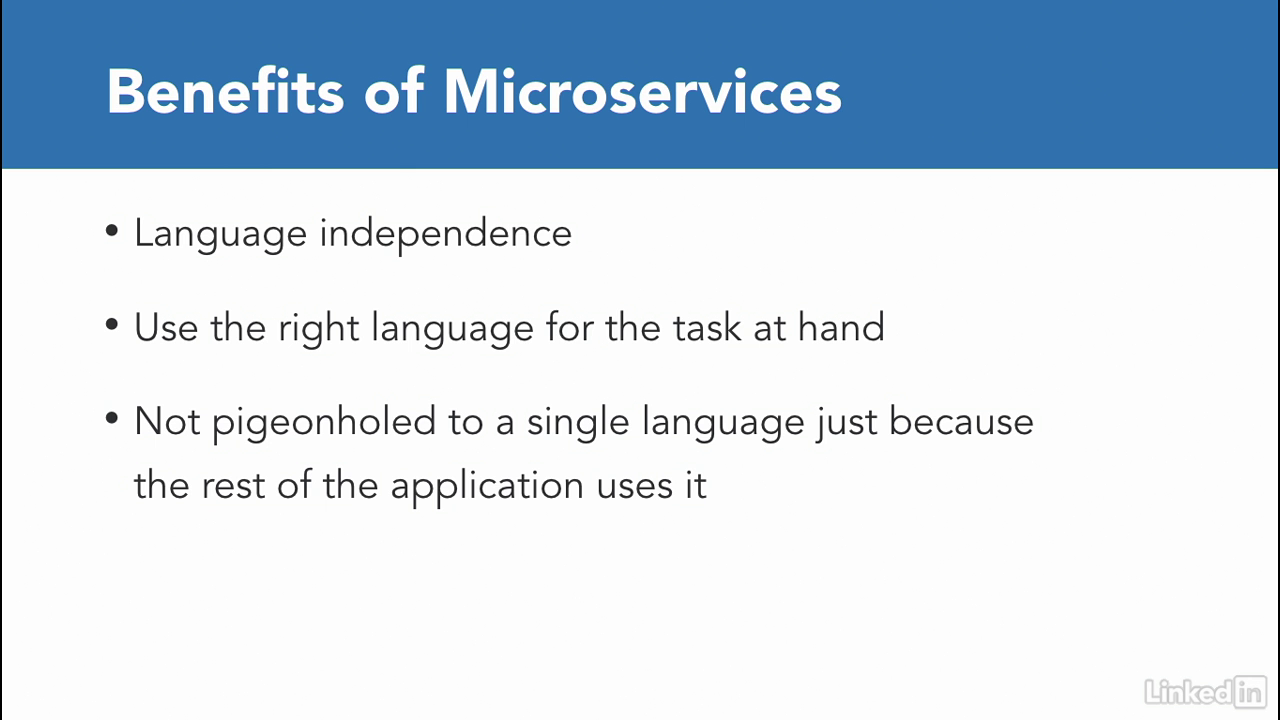
- Ever been in a situation where you knew that a certain language was the right fit for the task at hand but couldn't implement that language because the rest of the system was written in something else?
- Breaking up the application into multiple subcomponents that interoperate with each other but run independently buys you technical independence.
- You're allowed to use different languages or even different databases behind the scenes for different microservices in the application.
- That way, you're picking the right language for the job and aren't pigeonholed into using a suboptimal language just because the rest of the application is written in it.
Scaling
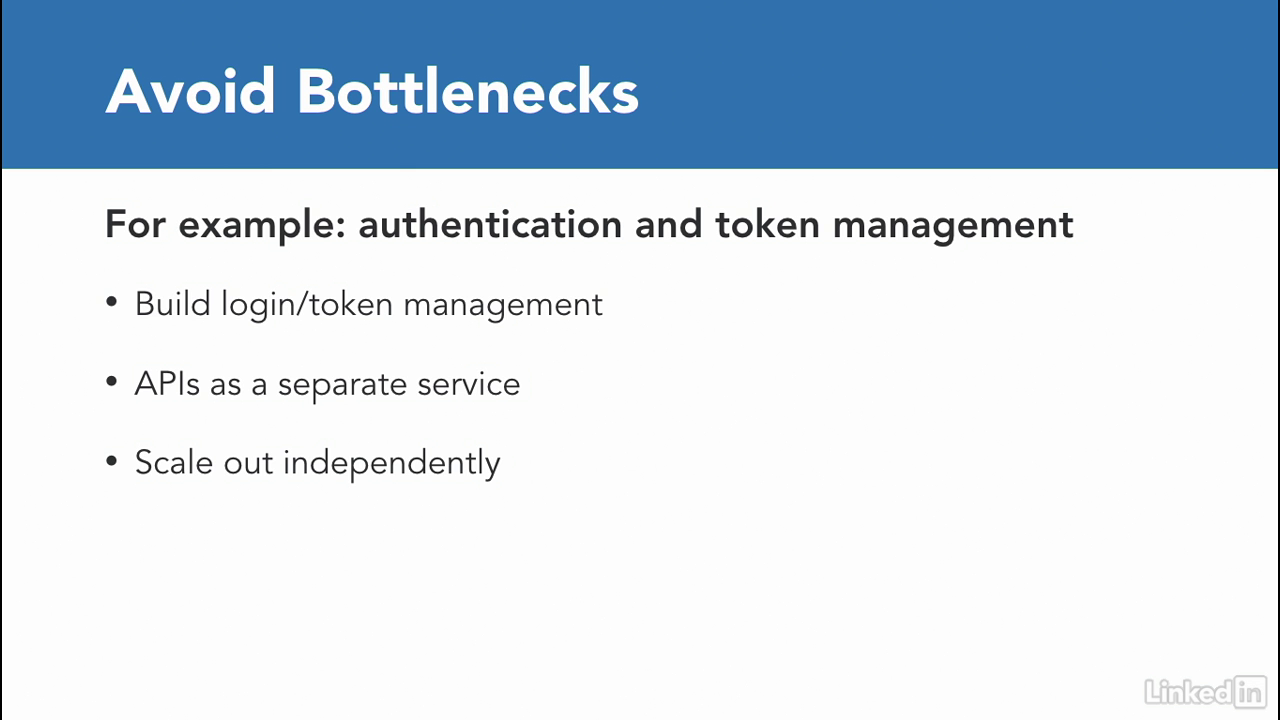
- When it comes to scaling, there's always some part of an application that is invoked by a lot of different modules or is the bottleneck for the rest of the application.
- As developers, we spend a lot of time trying to optimize these modules and also want to scale them so they aren't the bottleneck.
- In my line of work, authentication and token management is often called a lot from the rest of the code, so we'll use that as an example.
- Using microservices won't help me optimize the out modules, but it'll certainly help me scale them.
- I can build a login an token management API separately as a single service, and then scale these out independently as an app.
- Kubernetes also helps with scaling, and we'll talk more about this later on.
Deployment
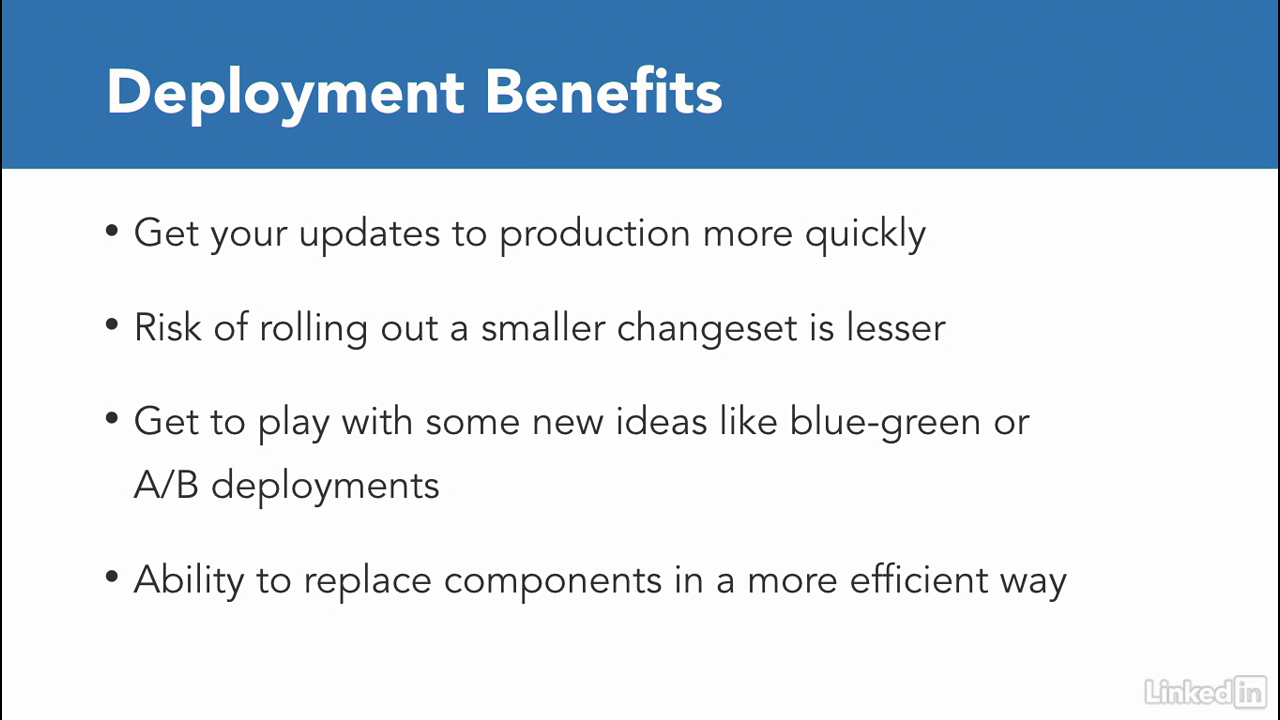
- Deploying your individual microservice also becomes easier in this new pattern.
- Continuing with our example, changes to an out API can be made and deployed whenever they are ready without having to update the rest of the application.
- There are several advantages to this.
- First, you can get your updates to production mode quickly.
- Second, the risk of rolling out a smaller changeset is much less than having to deploy the entire application.
- You get to also play with some new ideas like blue-green or A/B deployments.
- Finally, you are able to replace components in a more efficient way.
New opportunities
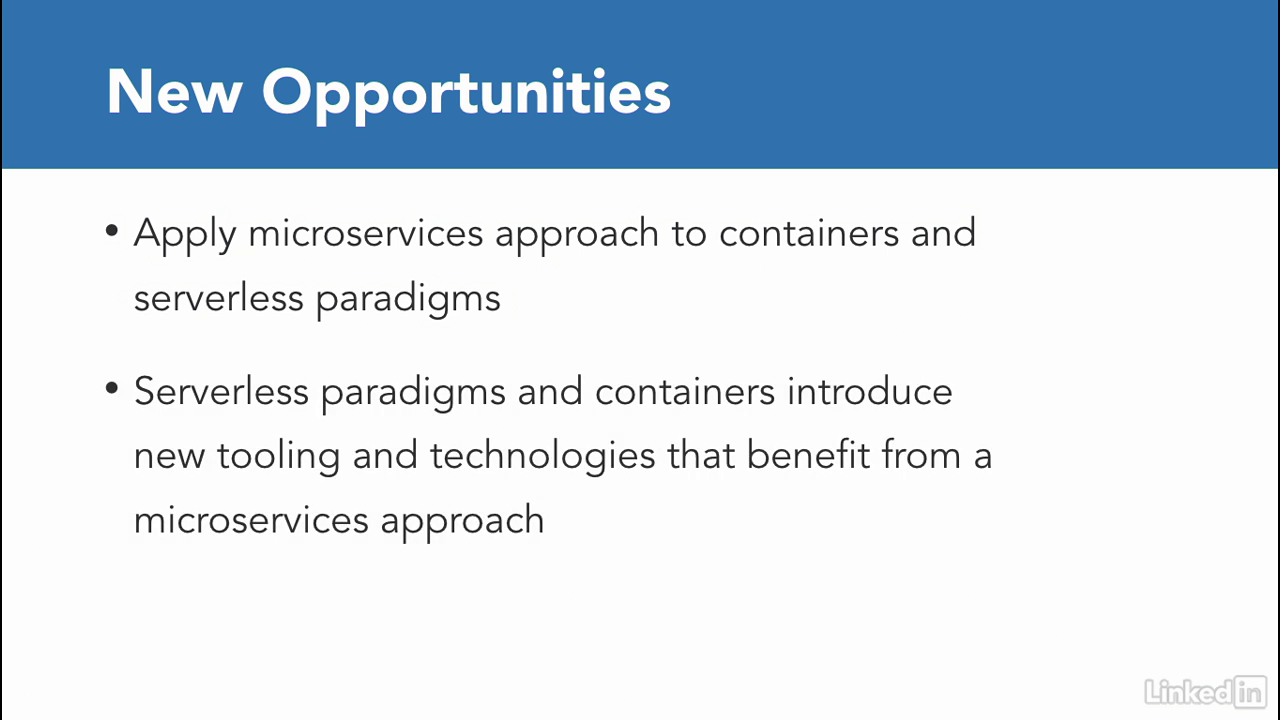
- Building services in this manner also open you up to a lot of new technologies.
- Containers and serverless functions are prime examples through which developers can pair down larger functionality into more modular code.
- With new technologies also come new tooling, like Docker, Amazon Lambda, Oracle Functions, and of course Kubernetes and the Cloud Native Computing Foundation projects.
- All of these tools might do different things, but they come together seamlessly using a microservices approach.
Lecture 006 - Common microservices patterns
The 12 factor app
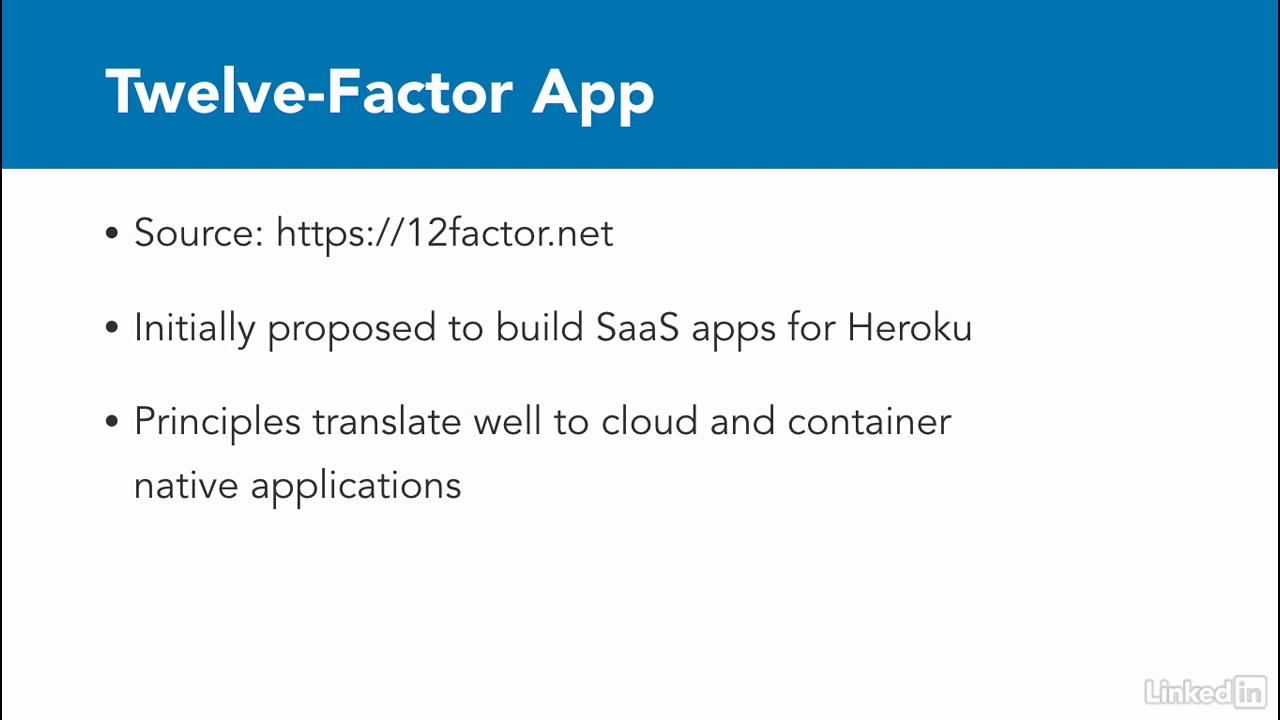
- In my experience, I've found that architecting micro services is the most successful when you follow the best practices detailed in the twelve-factor app methodology.
- The twelve-factor methodology was initially proposed for building software as a service applications for Heroku.
- However, almost all of the principles covered by that methodology translate to the micro services and container world.
- Understanding how to build applications in a lean and agile way will help you build micro services in a scalable and maintainable way.
- I've found the twelve-factor methodology indispensable in my career, so let's dive into these.
Principle 1
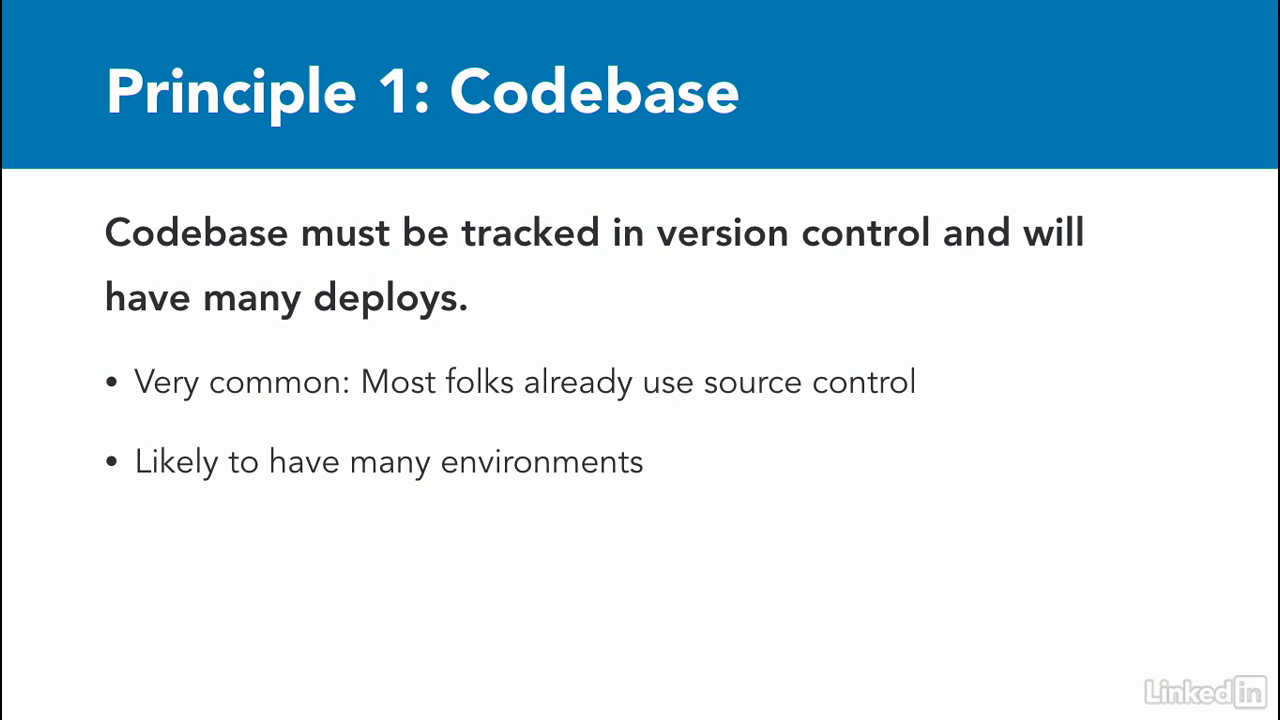
- The first principle has to do with your codebase.
- And it states that the codebase must be tracked in version control and will have many deploys.
- For most folks, this isn't a new thing.
- Code should be tracked in a single repo backed by a version control, and you'll probably have many deployments of the same application, like dev, staging, production, et cetera.
Principle 2
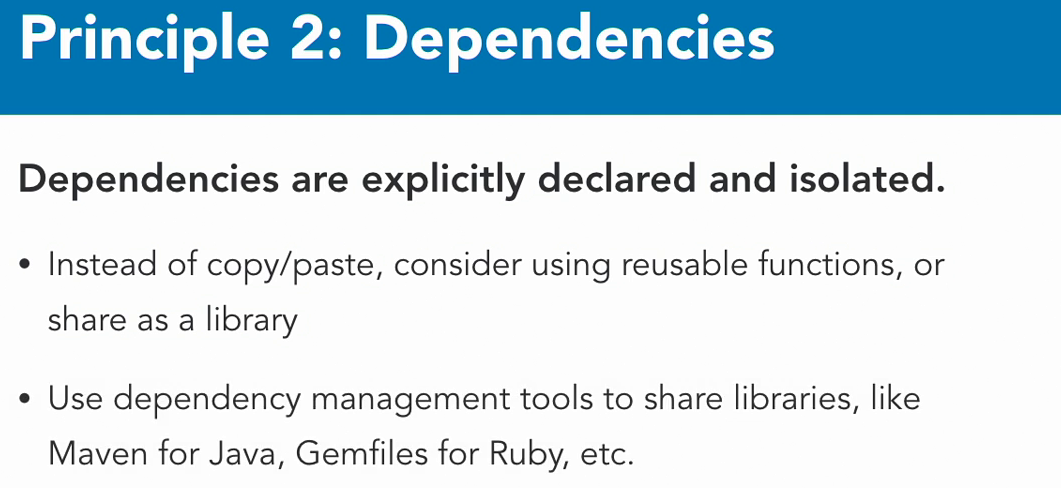
- Principle two is all about dependencies, and requires them to be explicitly declared and isolated.
- As developers, we write a lot of code and love to reuse it.
- I'm as guilty as anyone else for copy pasting pieces of code, but these days, when I find myself doing this, I always ask myself two things.
- One, should I rewrite this as a function?
- Or two, should I convert this to a library that can be called by anyone?
- There's an extra step with sharing libraries.
- You'll need to use a dependency management strategy for this.
- Like in Java, you might use Maven or in Ruby, a Gemfile.
Principle 3
- Next, we have configuration to store configuration information in the environment.
- Application configuration should never go into source code, but rather should be part of the environment.
- This is true whether it's a config file or uses environment variables.
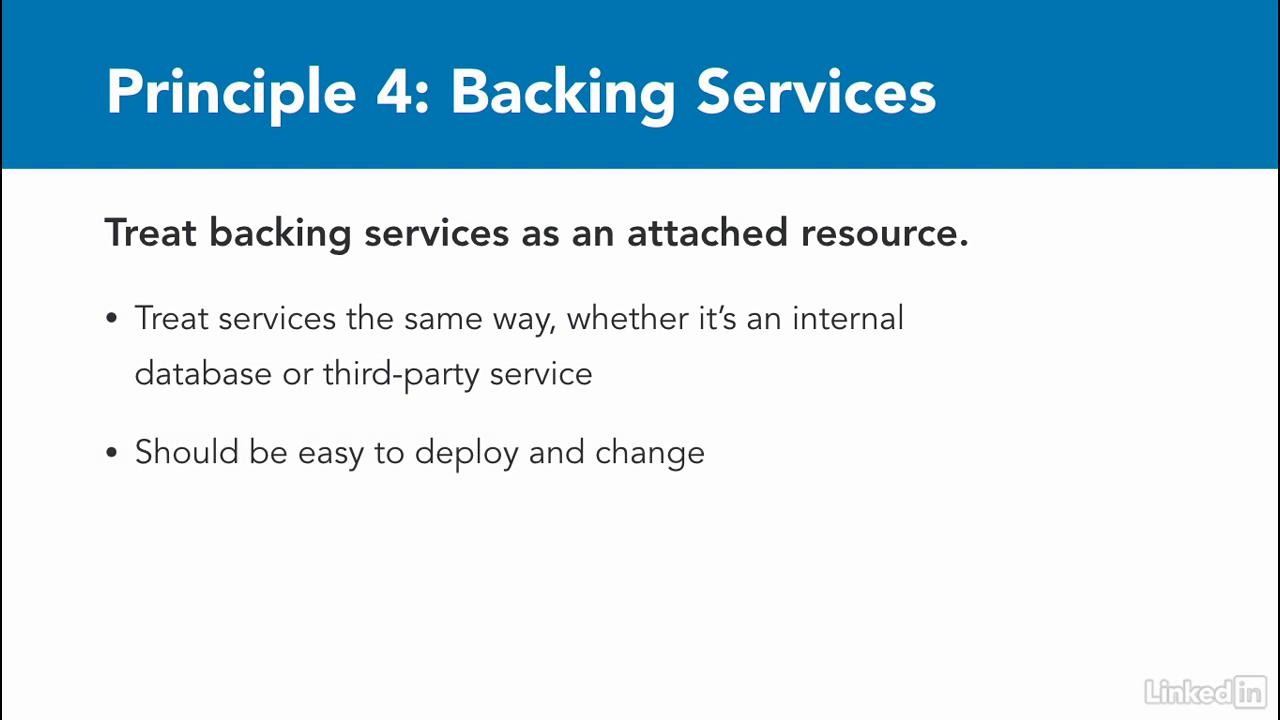
Principle 4
- Principle four is all about backing services and treating them as attached resources.
- Backing services can be a MySQL database, an SMTP email server, or a third-party service like a Twitter bot, et cetera.
- All of these are treated the same way and can be attached or detached from deploys at will.
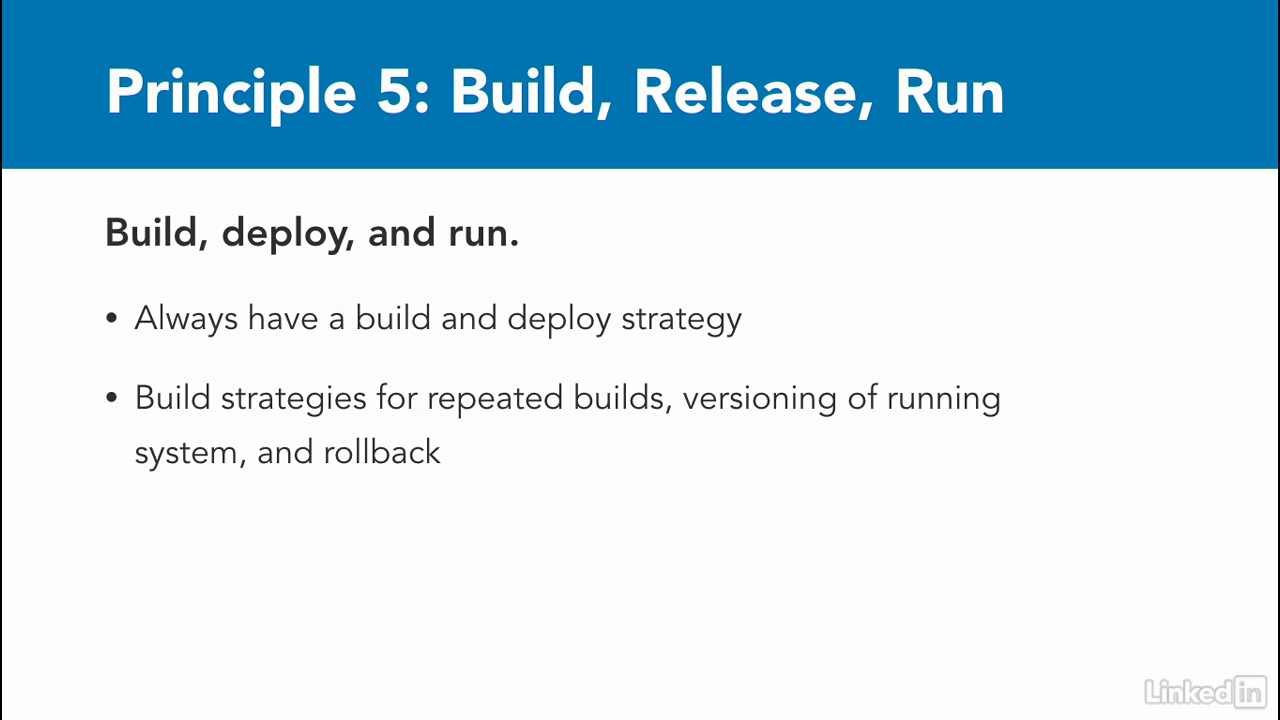
Principle 5
- The next principle ooches into a DevOps pipeline of build, release, and run.
- It promotes having a build and release strategy before getting an application into a running state.
- The importance here is not the tooling, but rather the ability to have repeatable builds, versioning on your running system, and a way to release or rollback.
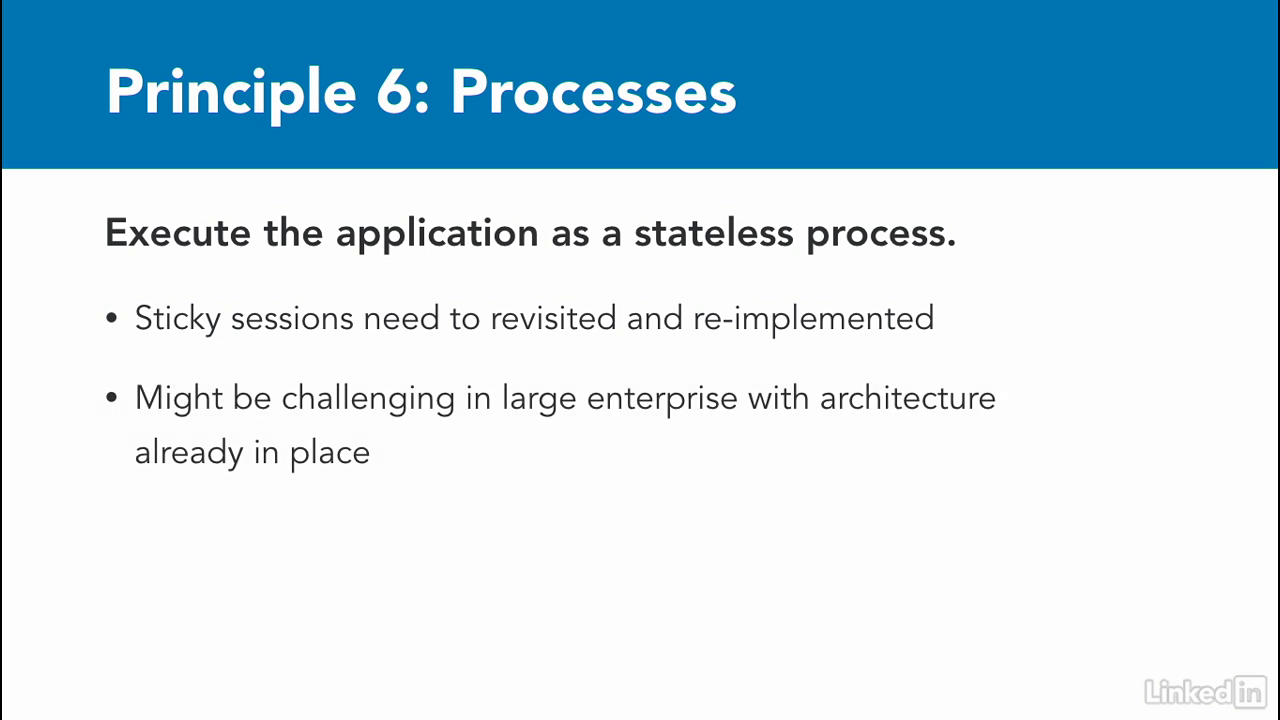
Principle 6
- Of all the factors, I think processes is the one that is the hardest to fully understand.
- It states that the entire application is executed as one or more stateless processes.
- For those working in large enterprises, this might be harder to implement because of existing infrastructure that is already laid out in terms of caching or sticky sessions.
- These ideas may need to be revisited and reimplemented in a different manner.
Principle 7
- Another proposition that may be challenging to translate in a large enterprise is port bindings, which declares that services should be exposed via port bindings.
- Enterprises already map applications in a specific way, and you may need to revisit the way these are designed to account for using port bindings.
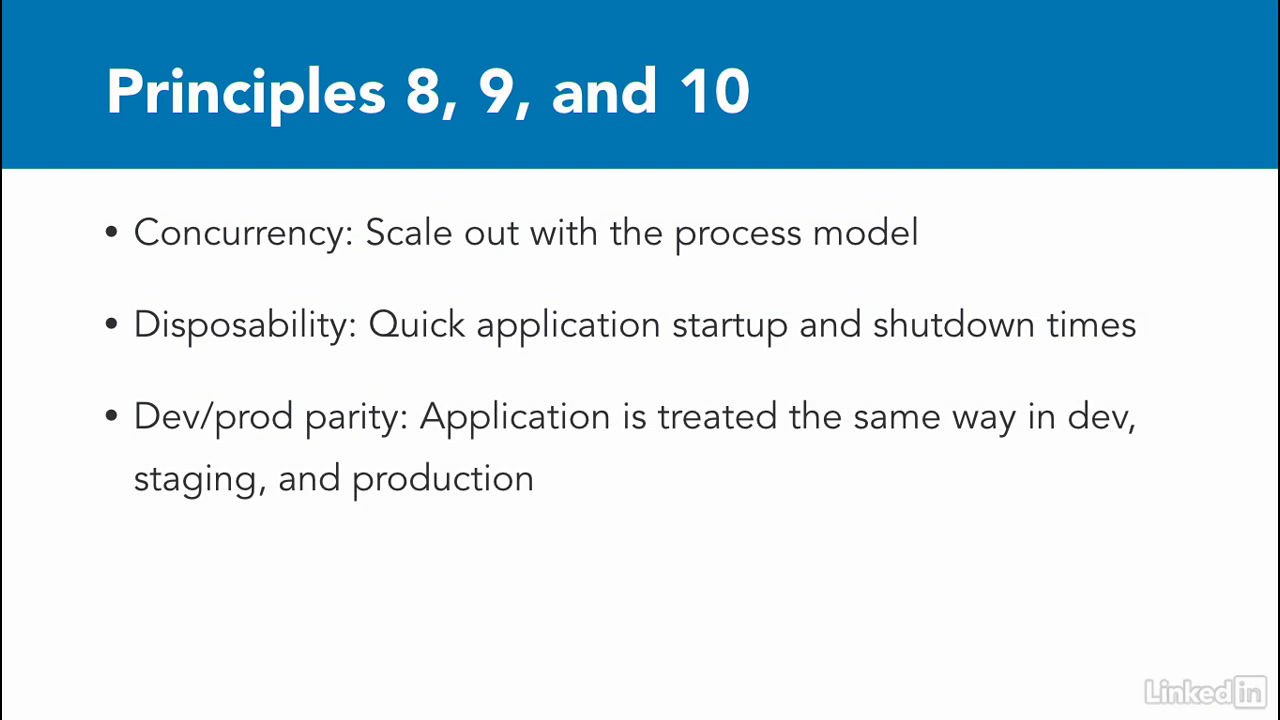
Principle 8-9-10
- The next three rules are somewhat related in my opinion, and are concepts that architects think a lot about.
- Concurrency, disposability, and the dev/prod parity.
- For concurrency, it's encouraged that applications scale out via the process model.
- Disposability has to do with quick application start up and shut down times.
- And the dev/prod parity is to try and keep the application working the same way in any environment that it's deployed in.
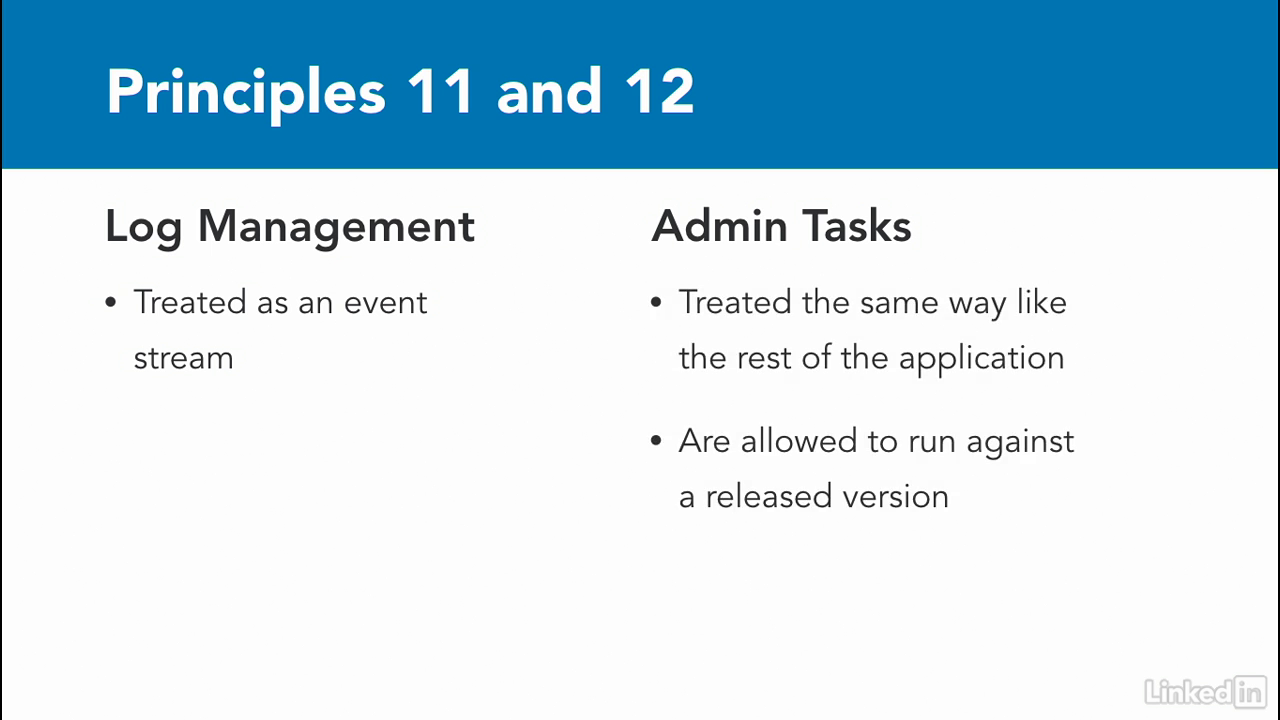
Principle 11-12
- Finally, the last two principles come back to concerns that are fundamental once the app is released.
- Log management and admin are one-off tasks, you know, things like reporting.
- Treat logs like an event stream and run admin related tasks as one-off processes.
- Admin tasks should be treated the same way as the rest of the application, but should run against the release and ship alongside the code to avoid versioning issues.
Summary
- It feels like we have covered a lot of architectural theory in this section.
- But it's important to understand these concepts so that we can implement them using containers and more importantly, in Kubernetes.
Chapter 03 - Microservices Using the Kubernetes Paradigm
Lecture 007 - Microservices patterns in Kubernetes
Section
- We're going to break down the 12-factor principles and create a reference implementation for each of these using Kubernetes as a microservice platform.
Grouping
- I'm going to break this discussion into three sections: basic building blocks, deployment patterns, and runtime patterns.

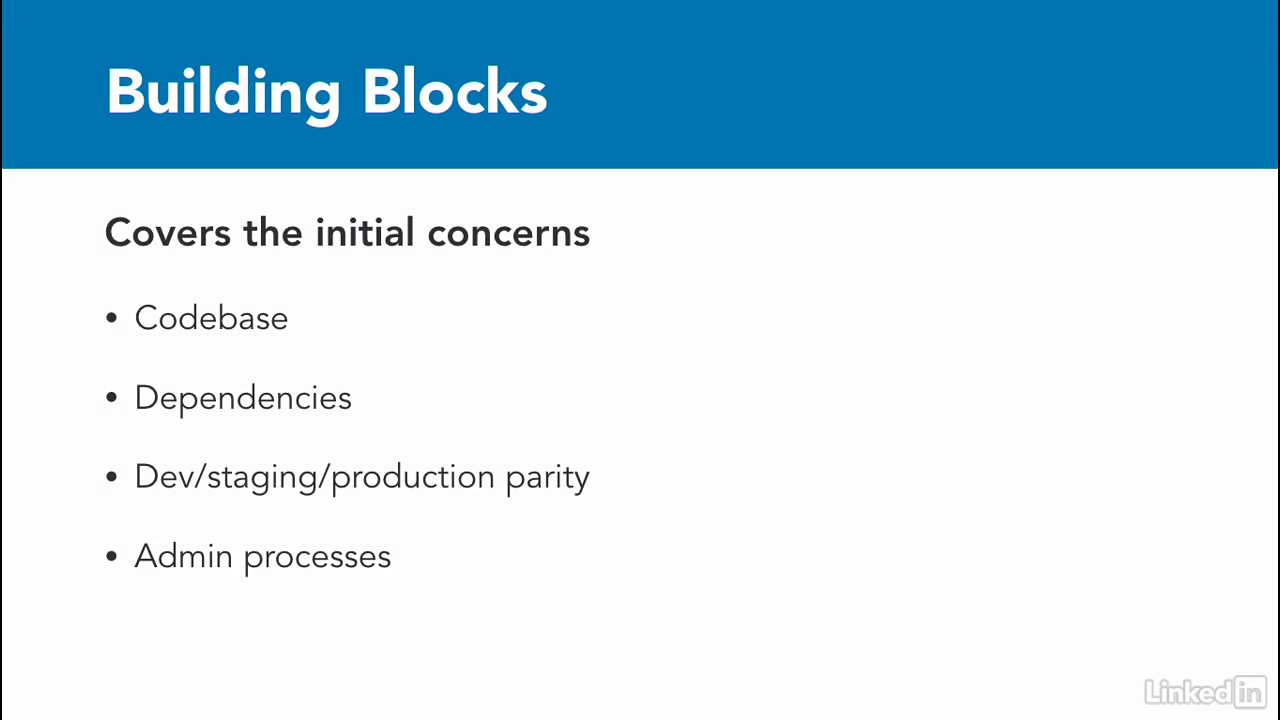
Building blocks
- In the building blocks section, I'll cover the basic concerns, including codebase; dependencies; parity between your dev, staging, and product environments; and admin processes.
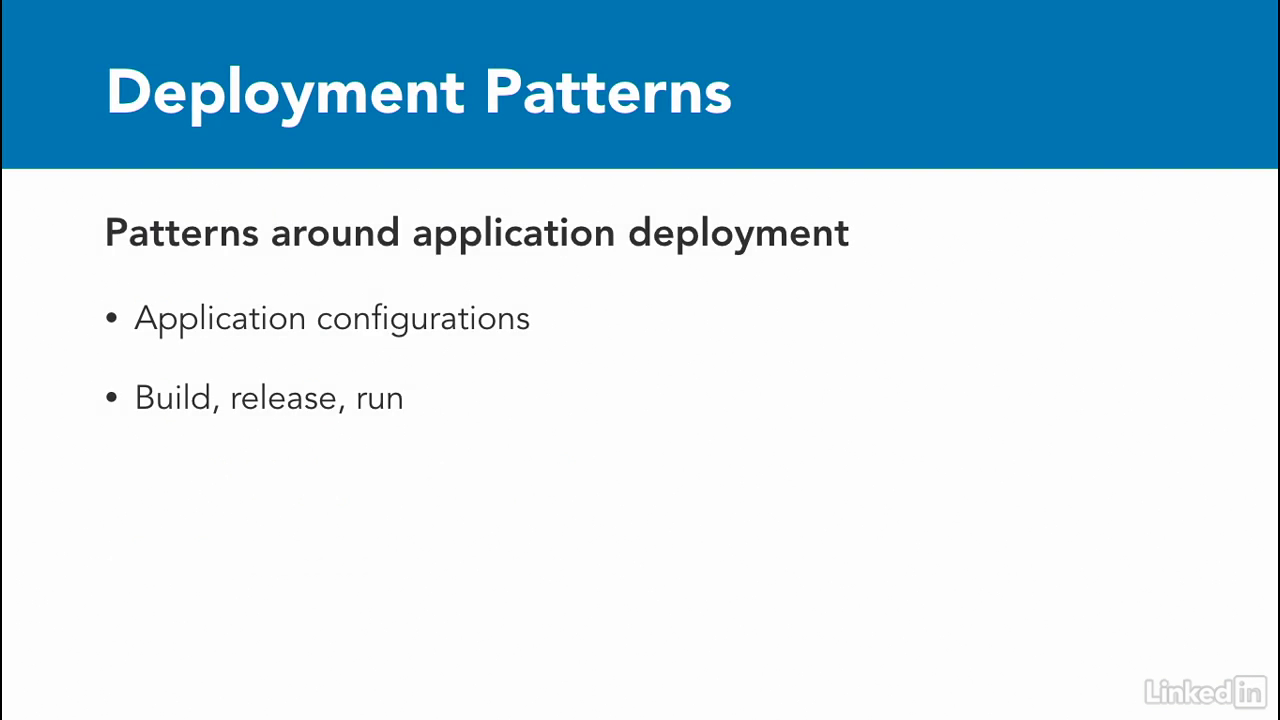
Deployment pattern
- In the deployment pattern section, I'll go over configurations; building, releasing, running your applications; processes; and port bindings.
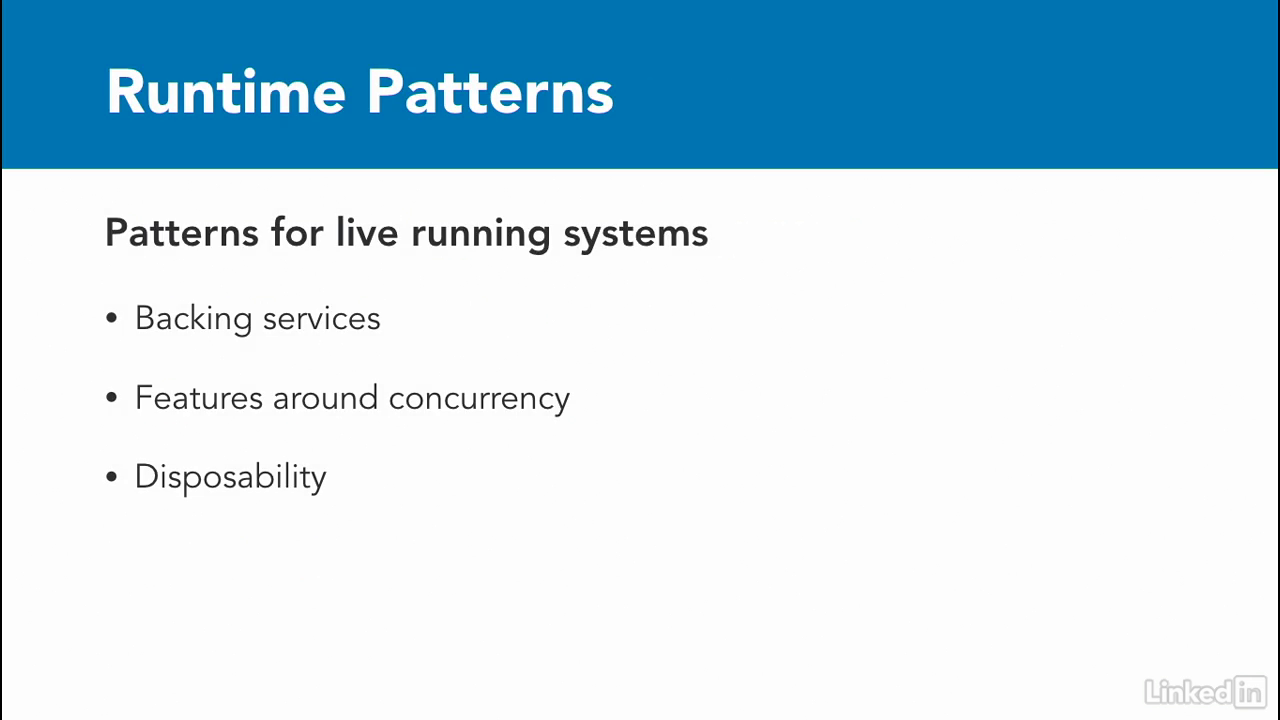
Runtime
- In the runtime section, I'll discuss topics that come up during the runtime of services, including backing services, features around concurrency, disposability, and log management.
Lecture 008 - Microservices building blocks
Section
- This section are ones that happen early in the development cycle and come up for architect when they're designing applications or for developers at build time.
Codebase
- First up, when we talk about codebases, we typically think of source control like GitHub or Perforce.
- In the container world, these are still important, but we mostly end up relying on container images that might be packaged by a continuous integration system.
Codebase workflow
- So if we're going to put this into a workflow, the first step would be to push your code into your source control repo.
- Next, we'd have an automated build kickoff and build your code and run your appropriate tests.
- Finally, once everything looks okay, we'll package the code into a container image and push it to a container repository.
- Docker Hub might be the de facto place to push your images if you're a startup, but larger enterprises might use private repositories, or an internal artifactory.
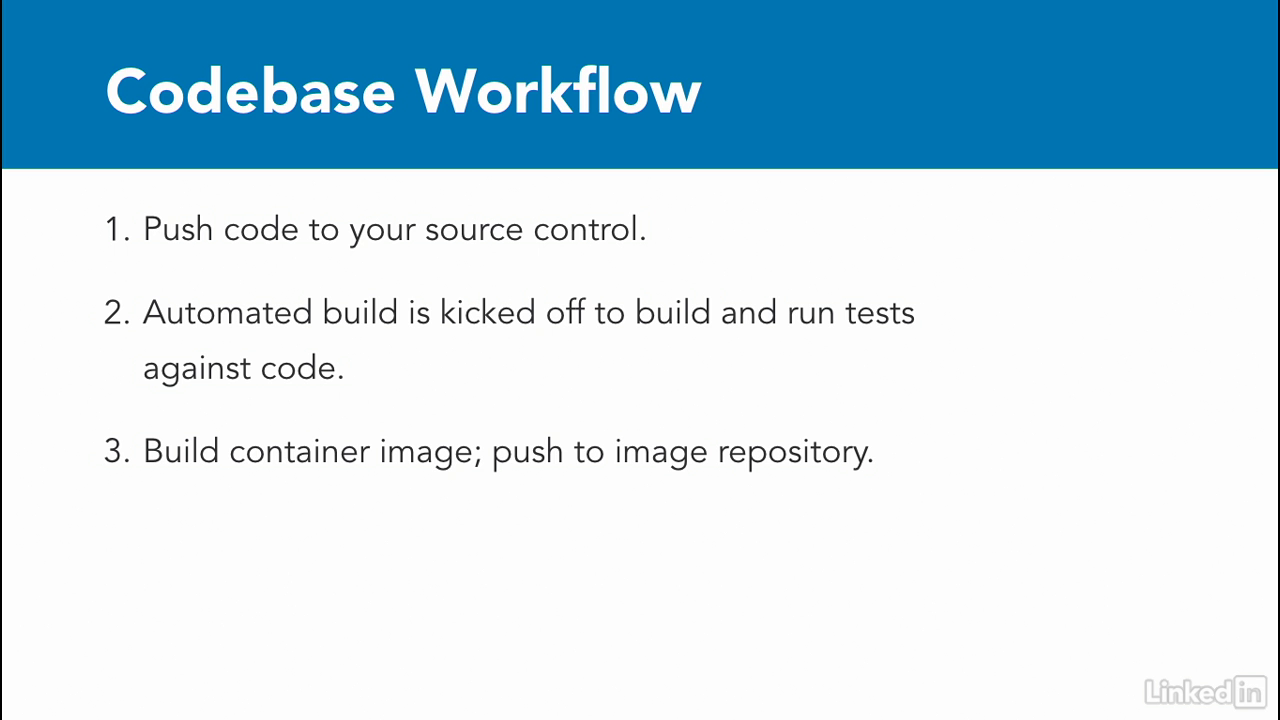
Image repo
- In summary, think of your container image repo as a way to store your code.
- You'll typically decide this early on.
- Remember, container images store your company's intellectual property, so make sure to treat the decision for your container repo the same as your regular source control system and always follow corporate guidelines.
App dependencies
- When we talk about application dependencies, we typically think of dependency management solutions like Maven, pip, gem or Glide, depending on the language you're working on.
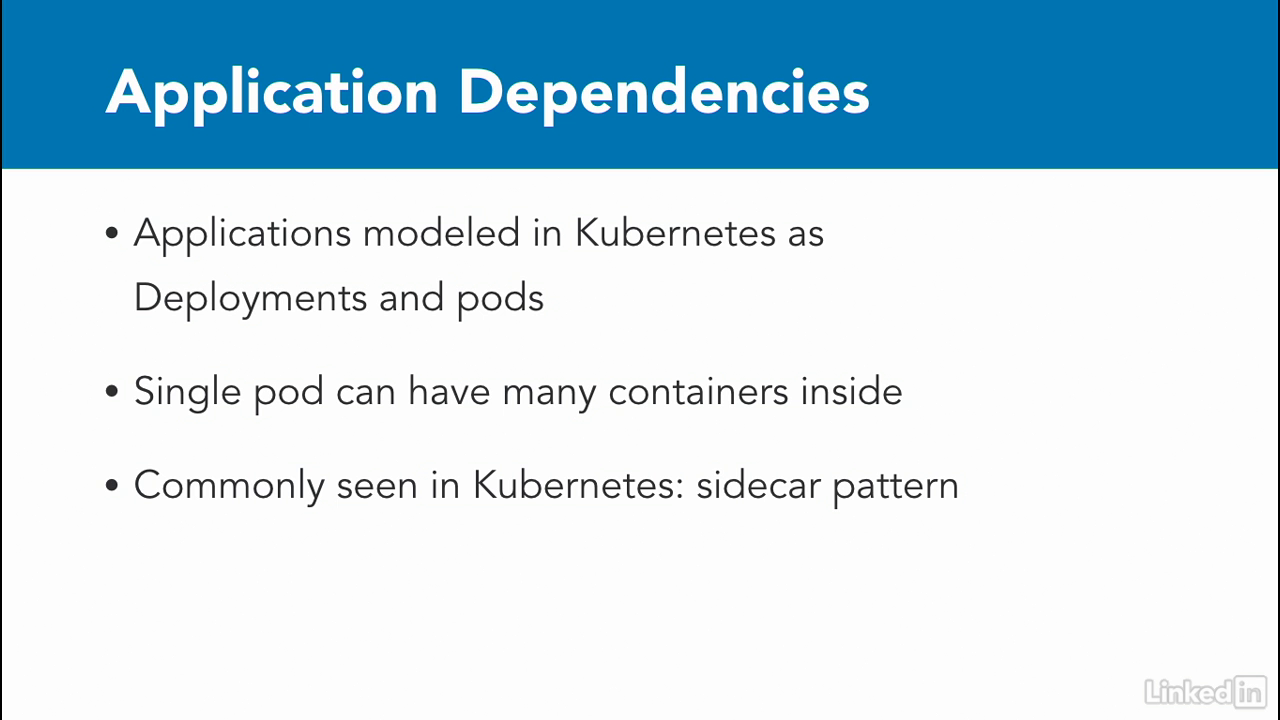
- In Kubernetes, typically applications are implemented as deployments, and break into pods.
- Pods are comprised, so one or more containers.
- One strategy for managing dependencies is to build a pod comprised of many containers that might contain your dependencies.
- This is actually common practice called sidecar pattern in Kubernetes, and it's often used for running logging in your application.
- We'll look at examples of this in the next session when we build out an application, but for now, just think of it as a way to manage dependencies.
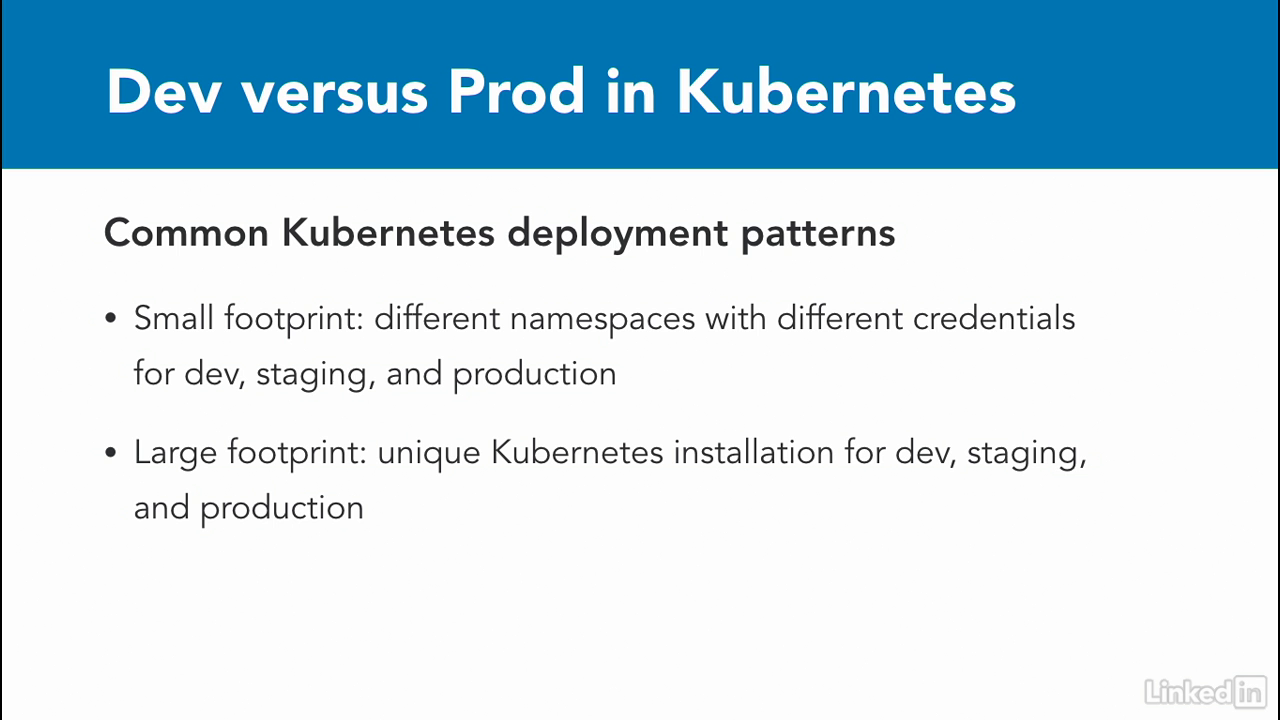
Dev vs prod
- Continuing on, there are many ways to handle dev versus prod deployments in Kubernetes.
- From an app perspective, the deployment to Kubernetes will always be the same for an application, provided the configuration of the application is stored in ConfigMaps and Secrets.
- But more on this later.
- To deploy applications while keeping the environments consistent, I've found two common ways that organizations handle this.
- For organizations with a small Kubernetes footprint, or few applications, they might use Kubernetes namespaces to ensure consistency.
- Different namespaces with different user and config files for access allow you to set security policies and access control.
- Organizations with large Kubernetes footprints end up creating additional Kubernetes installations and use completely different machines as worker nodes.
- This allows for a separation of concerns between applications running in development versus production, and scaling issues with an app and dev doesn't cause a production outage.
- So in the end, you have good options for how you can approach consistency in deployments based on the size of your organization, and its Kubernetes footprint.
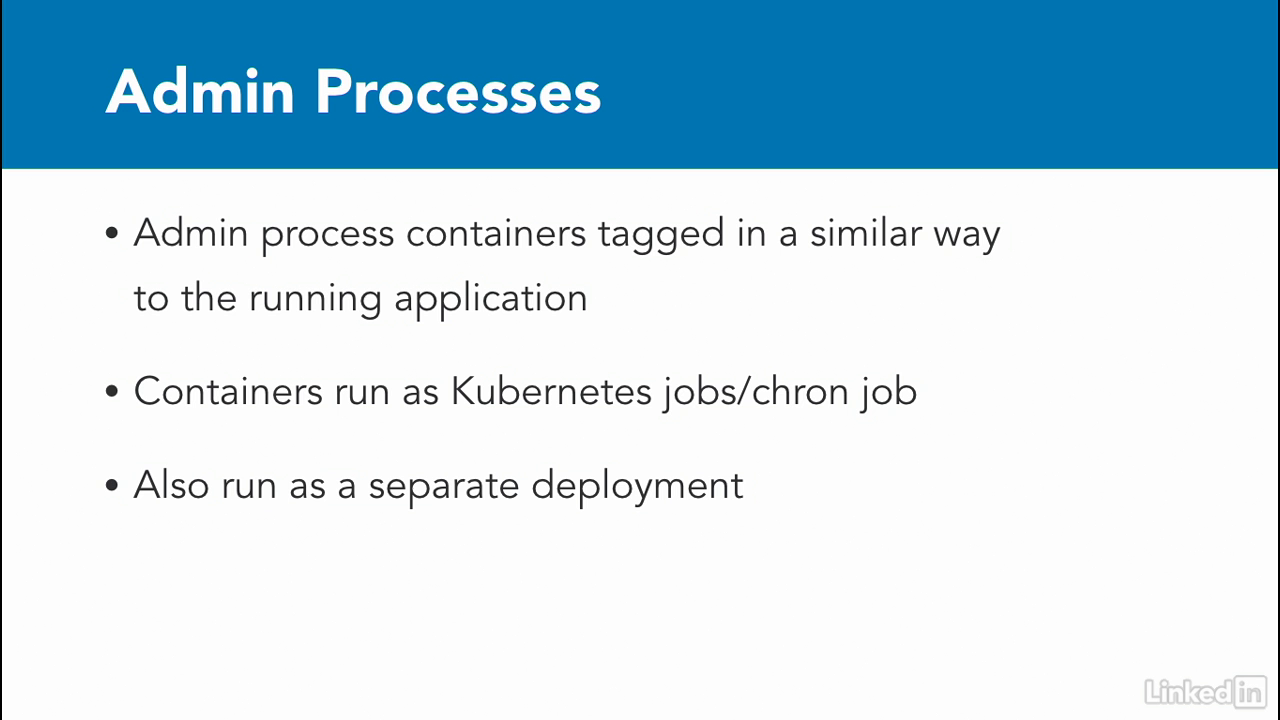
Admin process
- The pattern states that admin tasks are run as one-off processes.
- To be honest, I haven't seen a great reference implementation that has wowed me in the Kubernetes world.
- However, there are many good solutions for this.
- I've seen a lot of implementations where the containers running admin tasks are tagged similarly to those running applications so that the admin tasks are operable only with the right version of the software.
- From a task perspective, admin tasks are run as a Kubernetes job or a chron job.
- Finally, you can have a separate admin application altogether.
- However, it might need a new set of APIs, and an authentication scheme than the rest of the app, so that only internal users can access the data.
Lecture 009 - Deployment patterns
Section
- There are a lot of great features in Kubernetes that make the patterns defined in the twelve factor app framework for deployment a breeze.
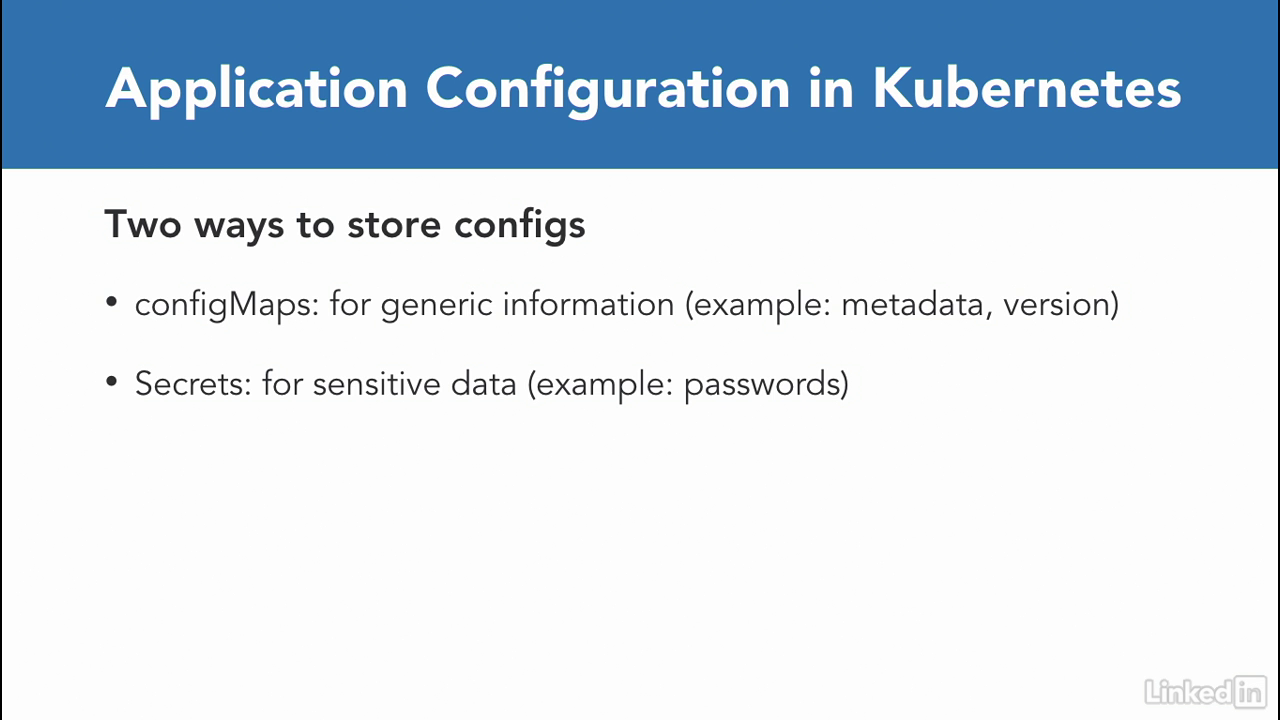
Configuration
- One of the first things I like about Kubernetes was the way it treated application configuration.
- Every application I know has config files to store application specific information.
- Kubernetes provides two ways for applications to store the configuration data outside of the actual application.
- As a result, it frees the application from its data, which makes the application updates a lot easier.
- The two ways provided are configMaps and secrets.
- You would typically use a configMap when you're trying to store application metadata in configuration.
- Anything that isn't sensitive data.
- Real world examples for these might include translations, system properties, and start up parameters.
- For the sensitive data, Kubernetes provides us with secrets, which are base64 encoded when they're at rest in the system.
- Storing sensitive data in secrets is more secure than plain text config maps, or in pod specification, and is the recommendation way to store this kind of information.
- Examples for this might be database passwords, SSH keys, OR tokens, etc.
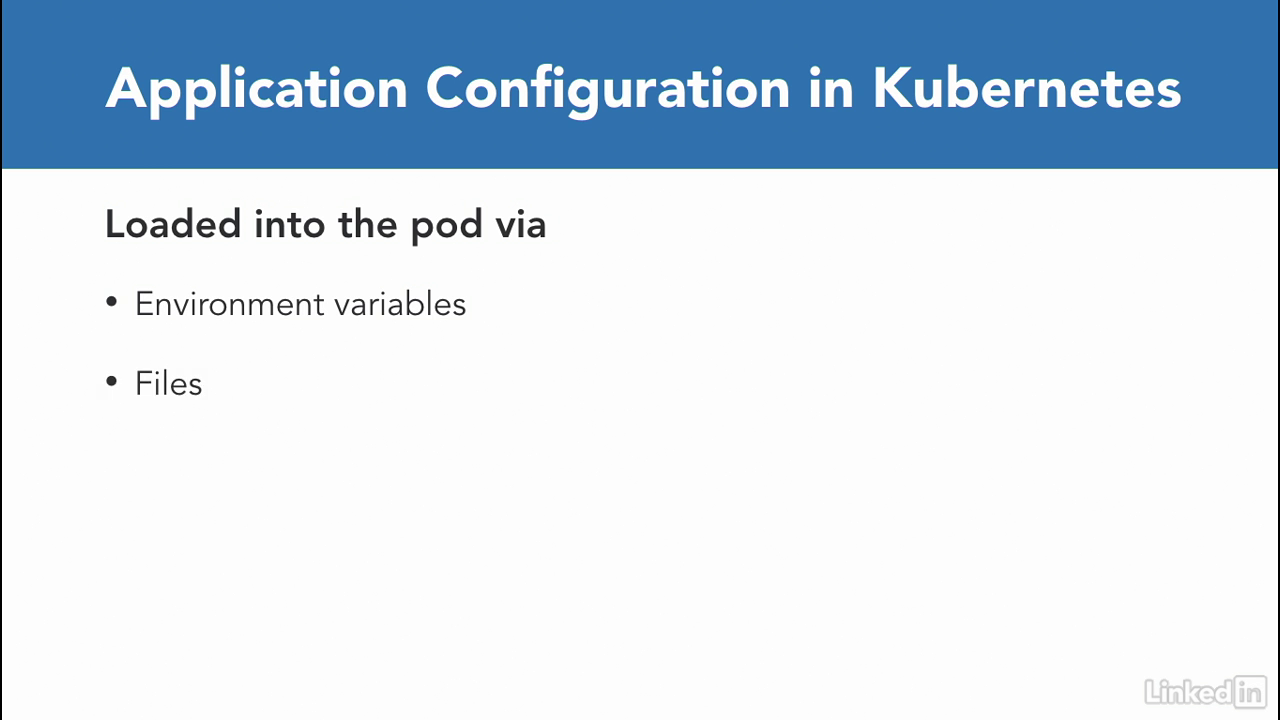
Configuration
- Once we have this information in configMpas or secrets, we will feed these values to the pod via environmental variables or as a file.
Side note
- As a side note, there's some debate in the community about whether sending sensitive data to containers is a safe thing to do.
- If you ask me, i think Kubernetes secrets are a good start, but if you need something more you could look at other mechanisms to pass sensitive information in a more secure manner.
- Take a look at HashiCorp Vault, which allows you to store your secrets in a more secure manner.

Build release and run
- Moving on from a build, release, and run perspective, we have already covered how our containers are built and stored in a container repository.
- It's also a best practice to tag your container image with a specific version.
- I've seen many ways that organizations do this, and it has become a best practice.
- A couple of examples are, by tagging each image with the build number created by a build agent, or by using a version number that tags to a specific version.
- Either of these methods are okay, just as long as you don't use the latest tag for your production assets.

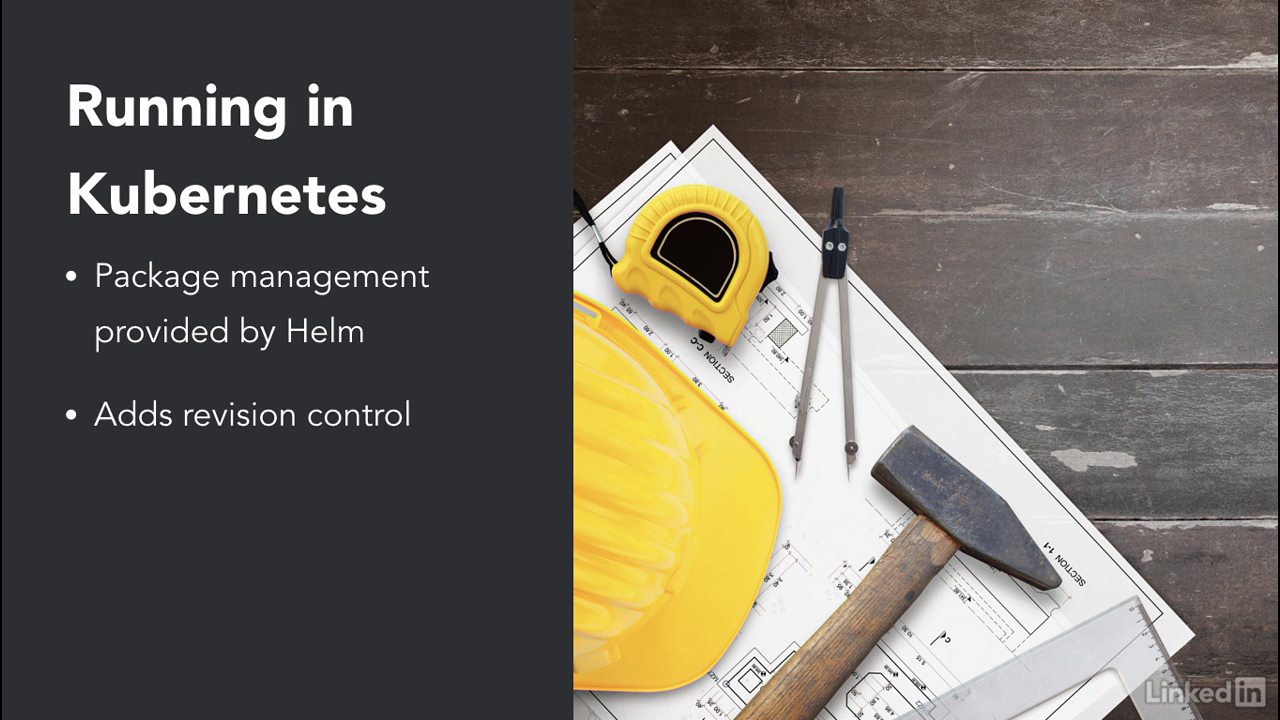
Running in kubernetes
- To run these containers, Kubernetes provides us with higher level constructs, like deployments, ReplicaSets, DaemonSets.
- You can use these to group your containers together in a specific way and deploy them together.
- There is also additional tooling in the ecosystem, like Helm, which allows you to package your application and apply a revision control to it.
- We'll see more of this in the demo, but for now just remember that you have options to manage your software deploys in a repeatable manner.
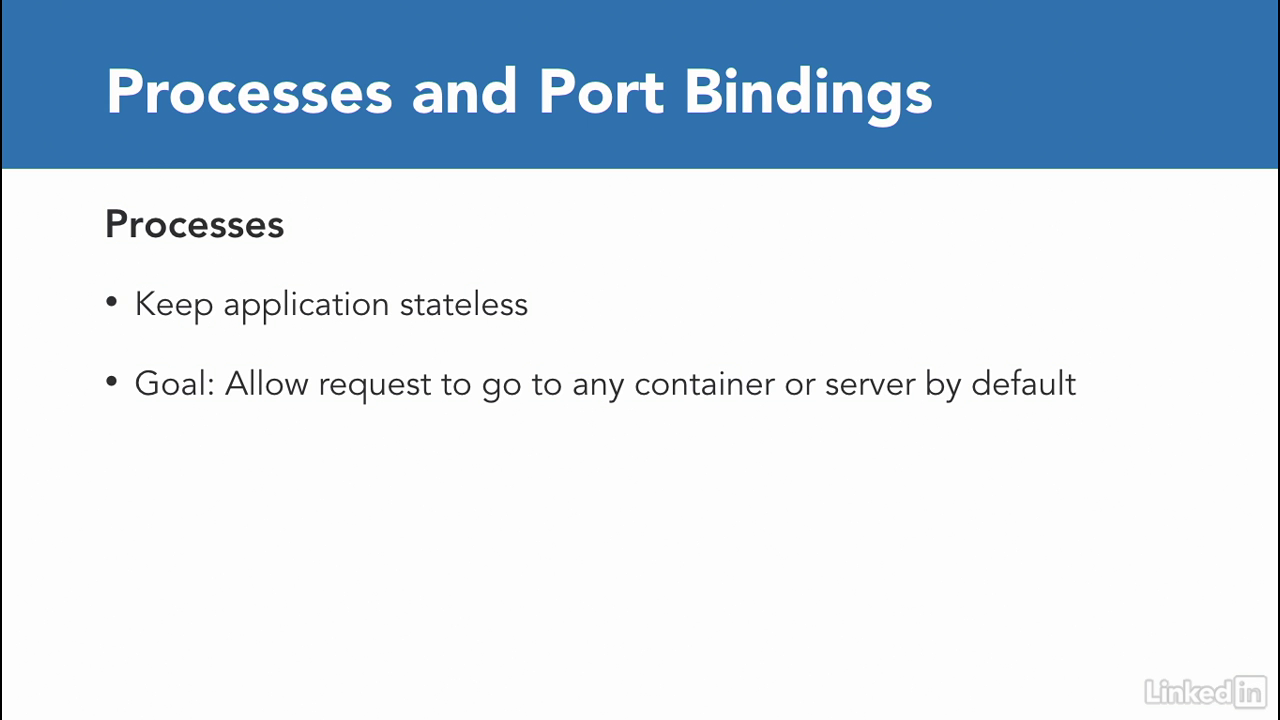
Process and port binding
- Principles five and six from the Twelve Factor app theory are processes and port bindings.
- For processes, it's recommended that the application is executed as one or more stateless process.
- For most developers who've started their careers as cloud developers, this is not something out of the ordinary.
- But for the rest of us, who work in enterprises or before the advent of the cloud paradigm, we have seen how servers and applications used to take advantage of sticky sessions.
- The goal is not to rely on the idea that the request will always go to the same server every time, and that any state data must be persisted in the database or cache that can be read by any of the servers.
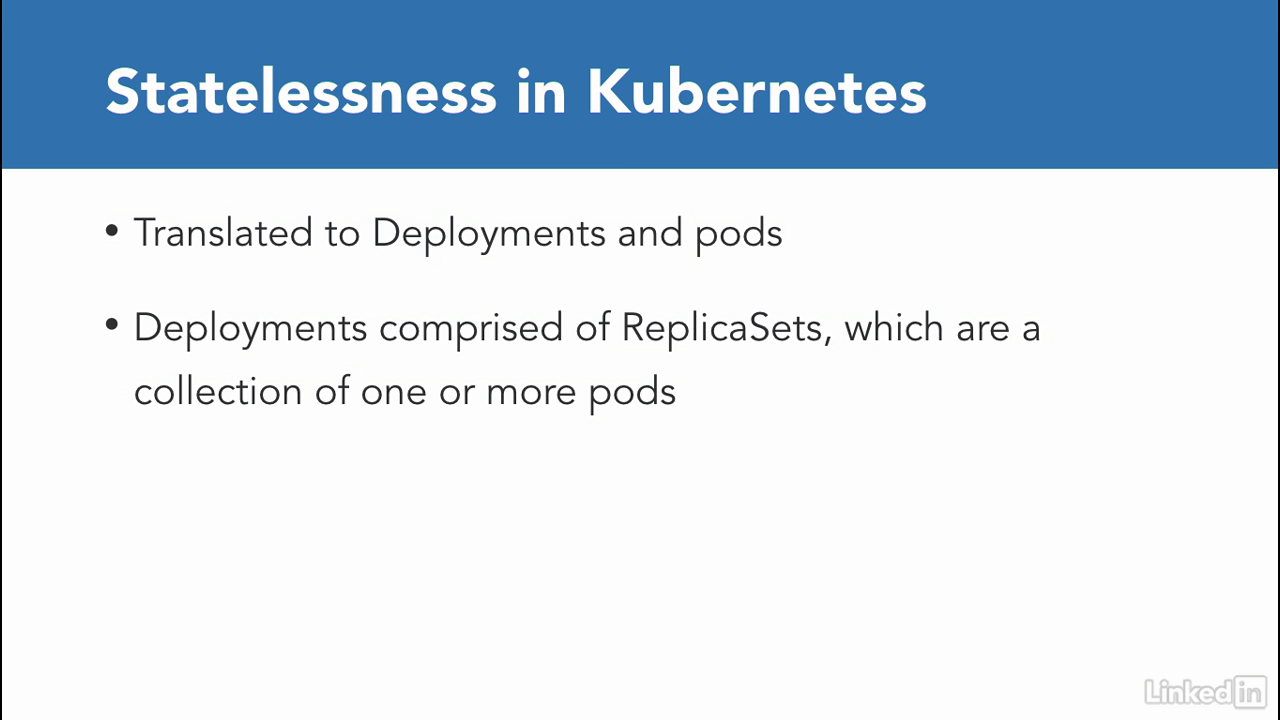
Statelessness
- In the Kubernetes worlds, statelessness translates directly to deployments and pods.
- Deployments are backed by ReplicaSets, that can contain one or more pods, and traffic is routed to any of these pods in the replica for each request.
- This process makes your application stateless by default.
Statefulsets
- There is a concept in Kubernetes called statefulsets that sometimes gets confused with sticky session.
- You typically use statefulsets to create a persistent storage.
- For example, if you're creating a MySQL cluster or a MasterMaster Cassandro cluster, you'd use the statefulset.
- Don't get this concept confused when building out web applications in Kubernetes.
Port bindings
- And lastly, when it comes to port bindings, it's sort of a part of the Kubernetes architecture itself.
Port bindings
- Kubernetes pods are built from containers and communicate with each other or the external world using ports.
- Pods listen for incoming requests on predeclared ports, and route these requests to the container running in them.
- This not only makes for an easy integration for the principle, but also facilitates an understanding of how the entire application will work.
Lecture 010 - Runtime patterns
Section

About resource
- When it comes to associating different resources in Kubernetes, everything is treated as a service and the configurations would be stored in the ConfigMap or Secret.
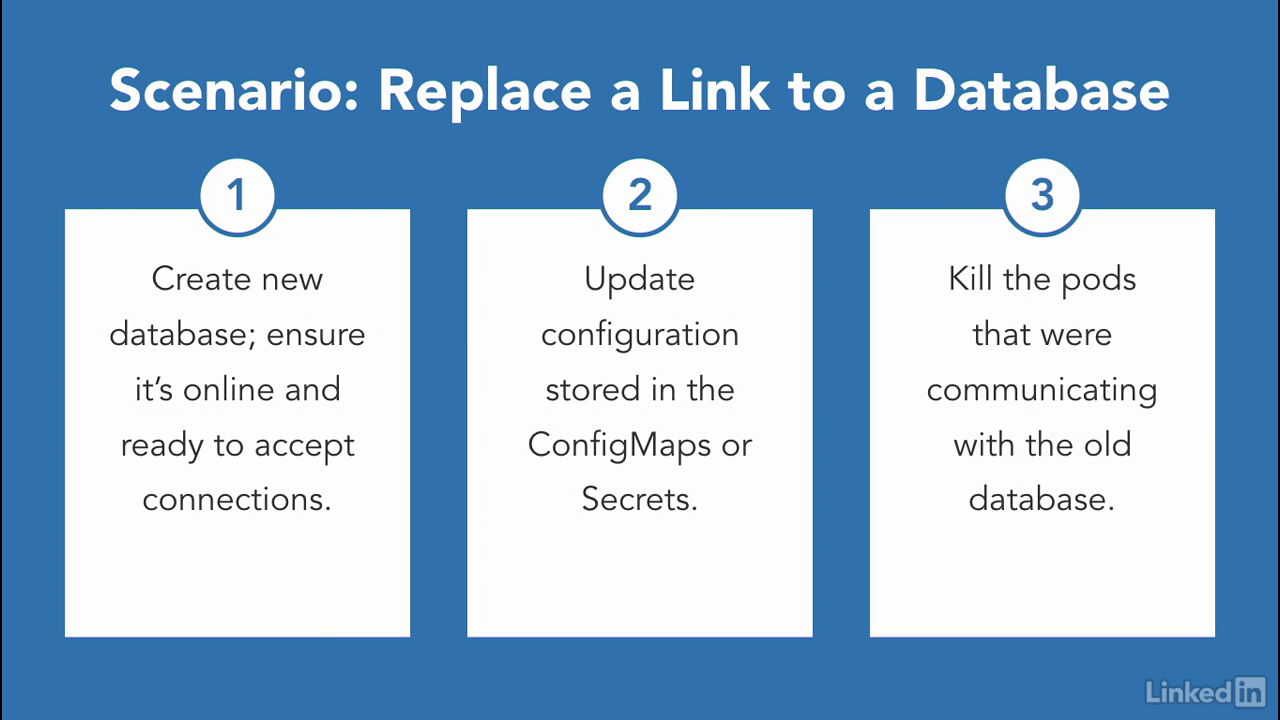
Replace a link to a database
- So in a scenario where we want to replace a link to a database, first, we'd have to create the new database and make sure it's online and ready accept connections.
- Next, we'd want to update our configuration that was stored in the ConfigMap or Secrets.
- Finally, we need to kill the pods that were communicating with the old database.
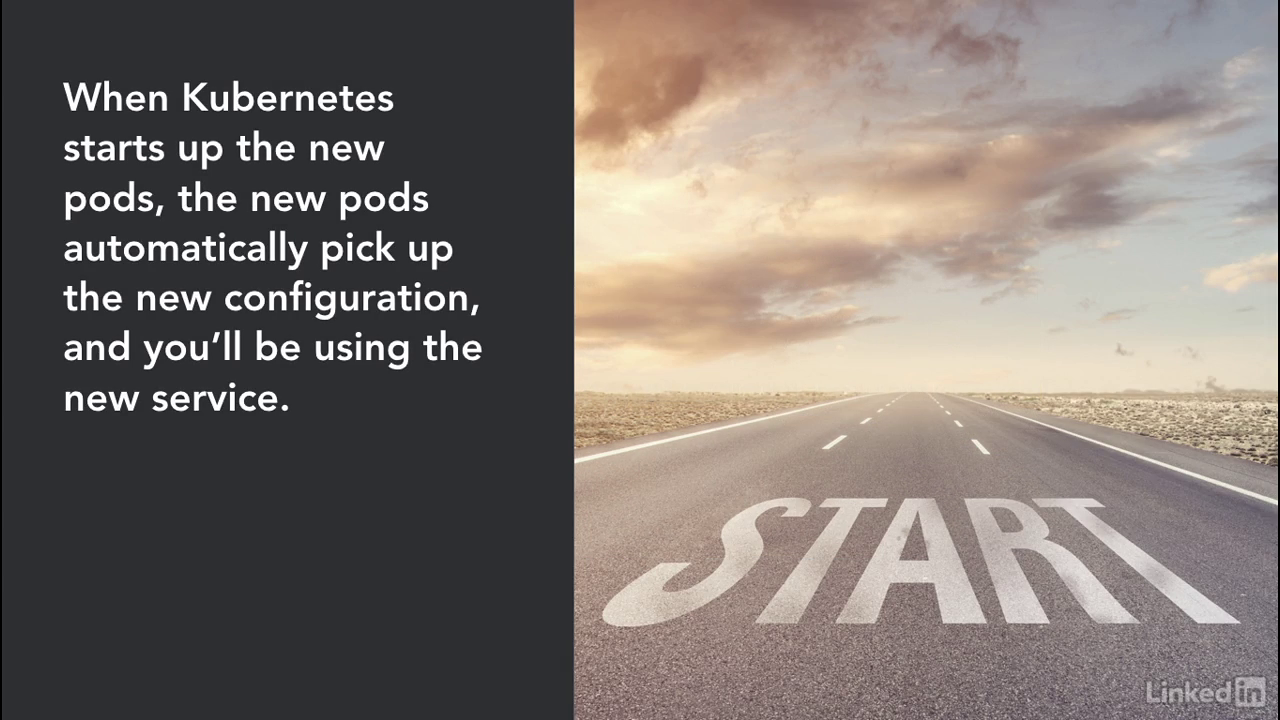
Starts up the new pods
- When Kubernetes starts up the new pods, the pods will automatically pick up the new configuration and you'll be using the new service.
Too much load
- From concurrency perspective, having a platform like Kubernetes to run your applications is awesome.
- If a pod is taking too much load or has too many requests being sent to it, it's easy to just scale out the number of pods by adding more to the replica set.

Scaling
- If the number of Kubernetes nodes are struggling to keep up with traffic, it's also easy to add worker nodes to the Kubernetes platform.
- Scaling out Kubernetes to handle more traffic is one of the strengths of the platform.

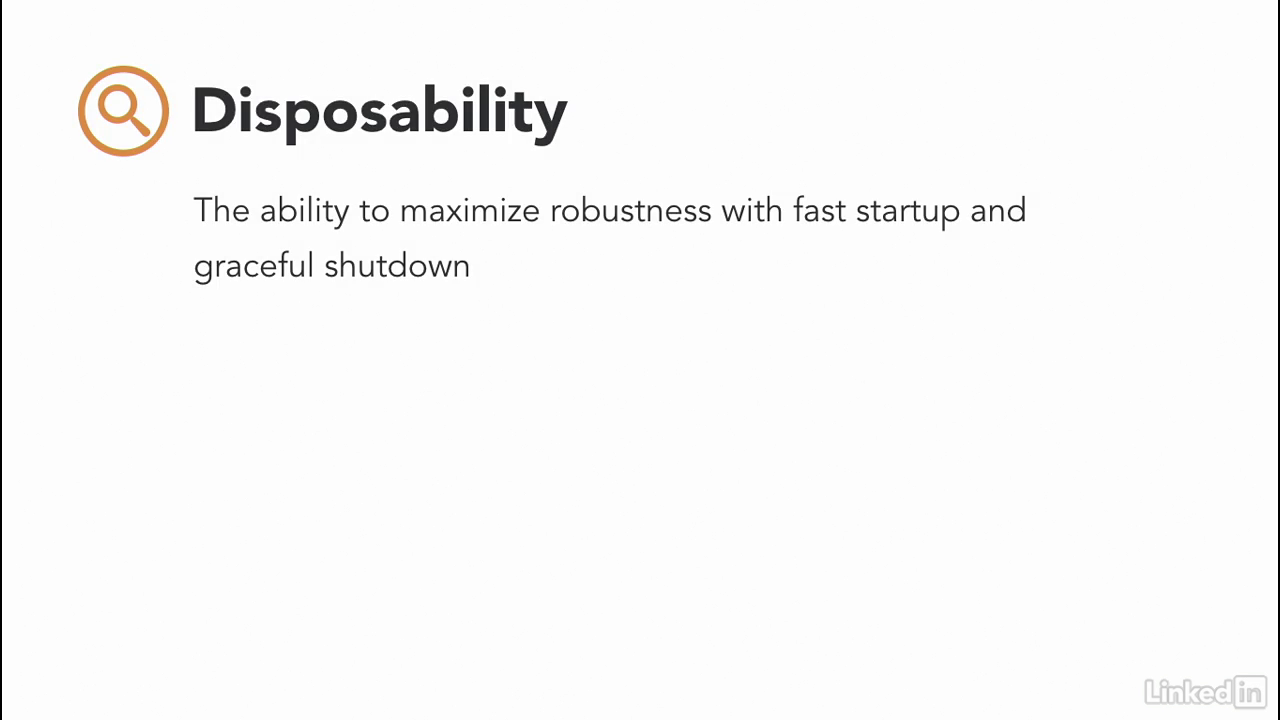
Disposability
- Another strength of the platform is disposability which is the ability to maximize robustness with fast startup and graceful shutdown.
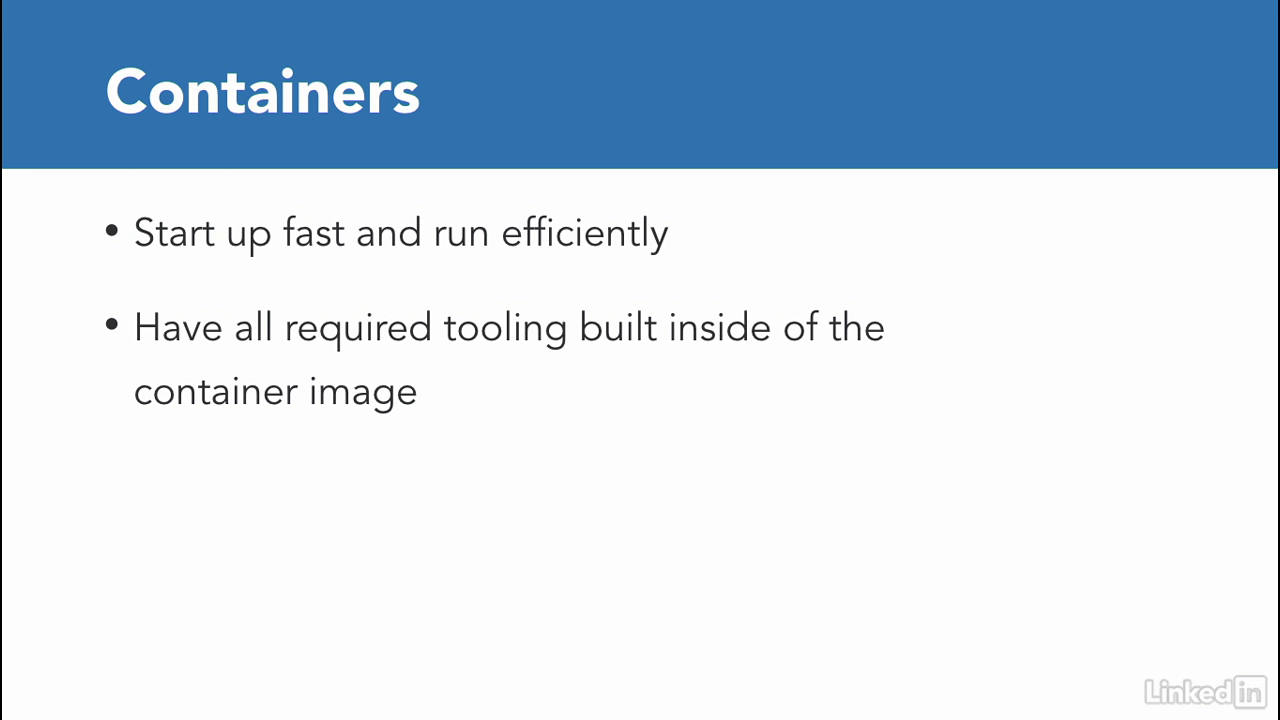
Containers
- Containers, by principle, start up fast and run efficiently because they have all of their required tooling built inside of the container image.
- Well it would still take a little bit of time to start up an Oracle Database running in the container.
- But, in general this principle is true.
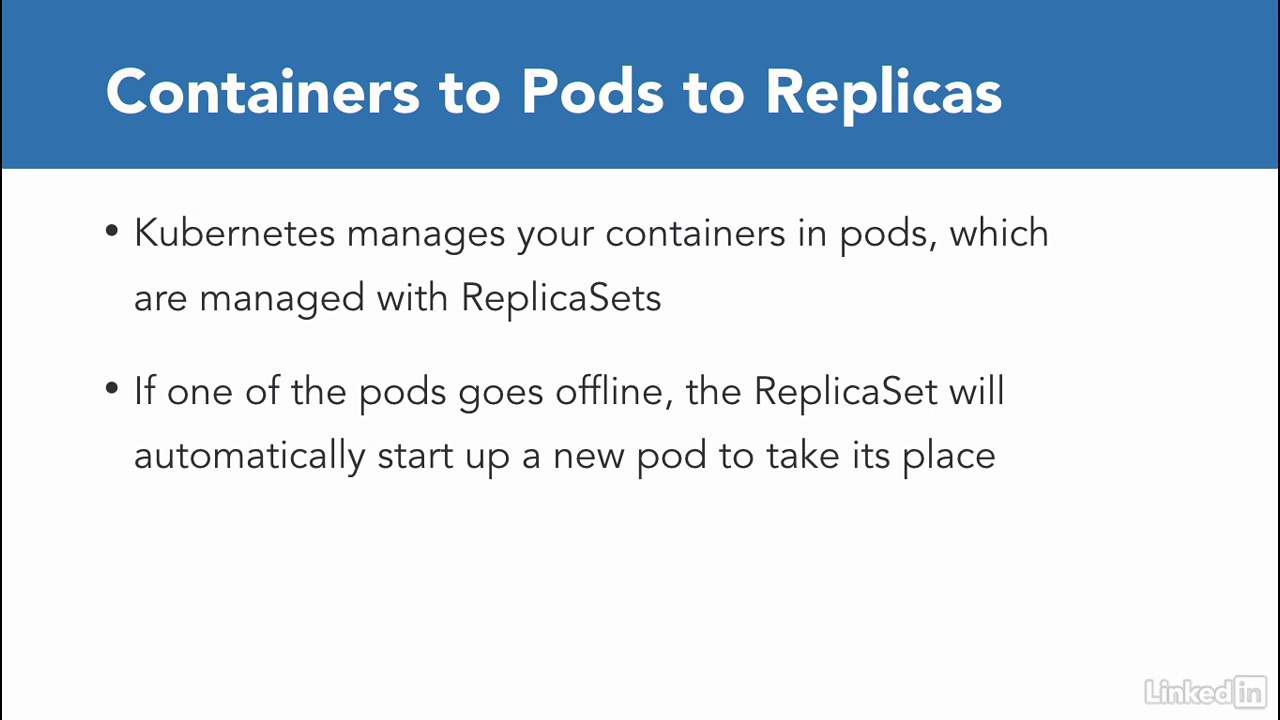
Manages your containers in pods
- Kubernetes manages your containers in pods which in turn are managed by ReplicaSets.
- If for some reason one of the pods goes offline or crashes, the ReplicaSet will automatically start a new pod to take its place.
User perspective
- From a user perspective, the application will still function and the user won't see any downtime and that's the most important part.
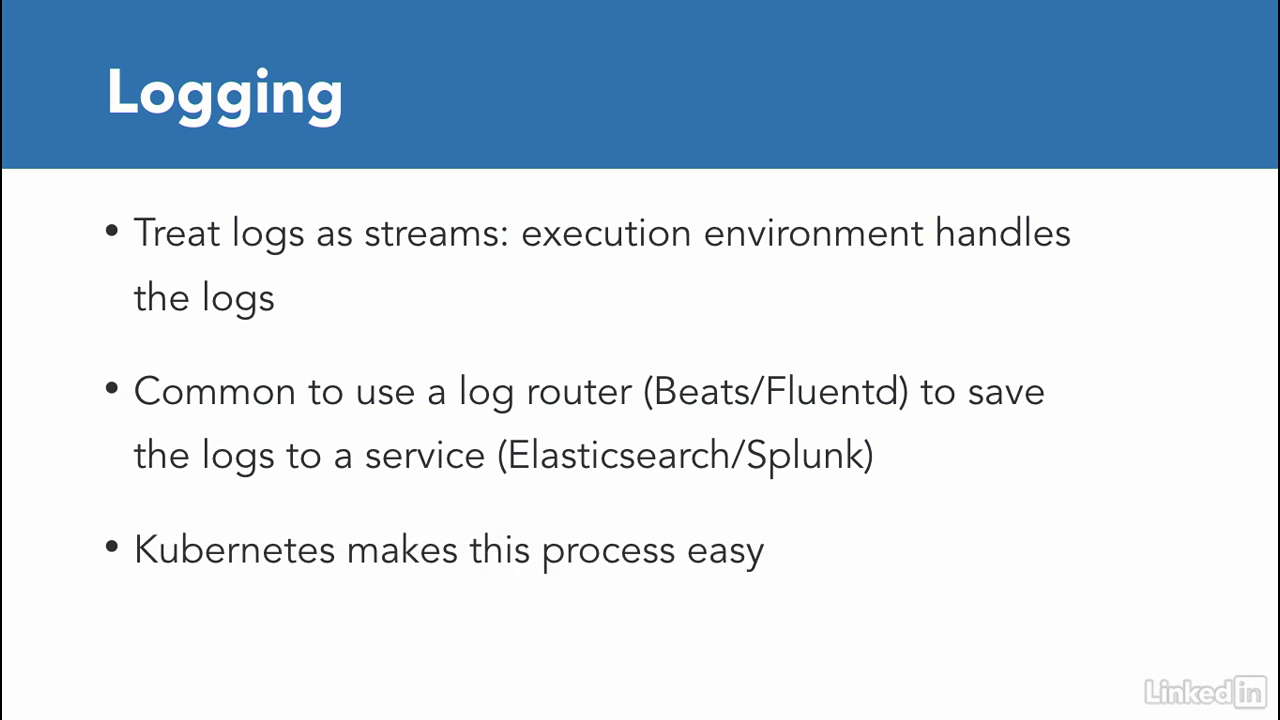
Logging
- Our last pattern is Logging.
- Most applications today, log to files and The Twelve-Factor App tells us to treat logs as streams.
- It's the job of the execution environment to handle the logs coming out in the right way.
- Most of the time we end up using the log router like Beats or FluentD to save logs to a service like Elasticsearch or Splunk.
- Kubernetes makes this process easy and there are plenty of ways to get your logs from standard out to somewhere more accessible.
- We'll see this in our examples where we'll ship logs using a log router and collect logs from our application.
Chapter 04 - Example K8s Microservices Application
Lecture 011 - From monolith to microservice
A single monolith application
- I once worked in a large enterprise where we had a large team of developers work on a single monolith application.
- New hires would take weeks to get up and running.
- And then be scared to make changes to the large code base.
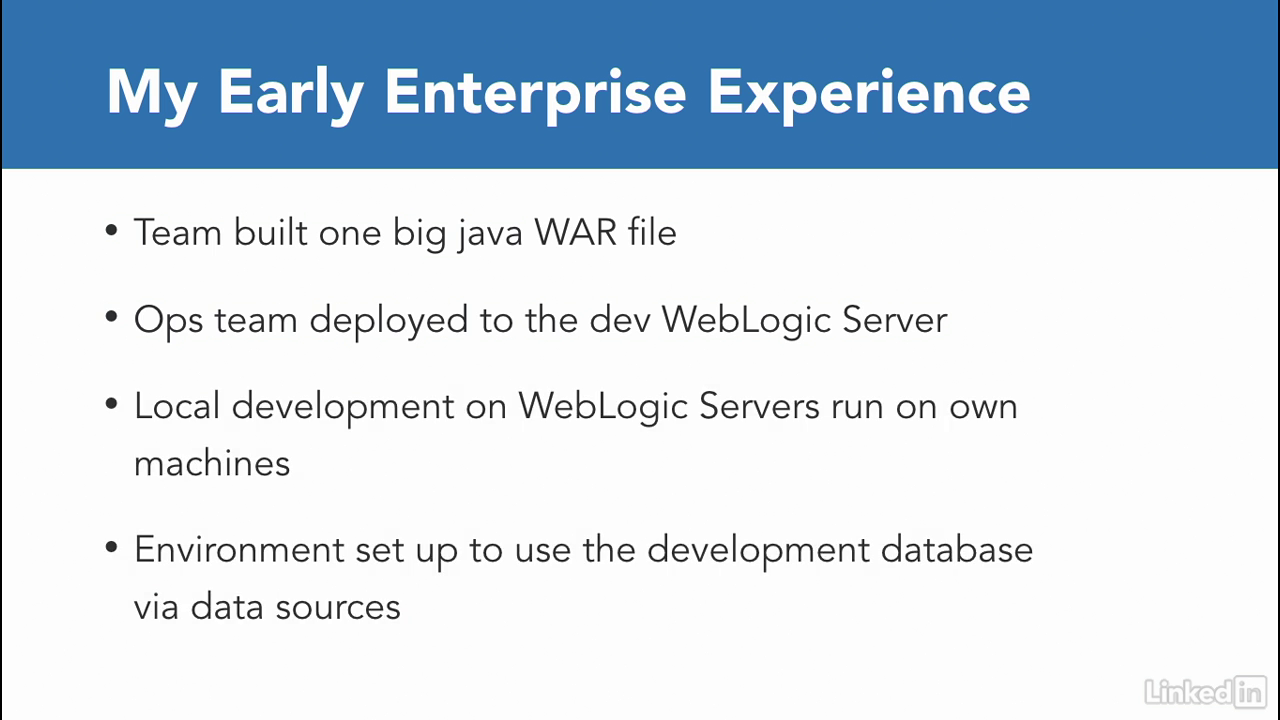
- All of us played a role in building one big JAVA web application resource file.
- Which is commonly known as a WAR file.
- We would have this deployed to the dev WebLogic server by the operations team.
- Locally, we developed on WebLogic servers that we ran on our machines and set up our environment to use the developing database via data sources.
A single monolith application
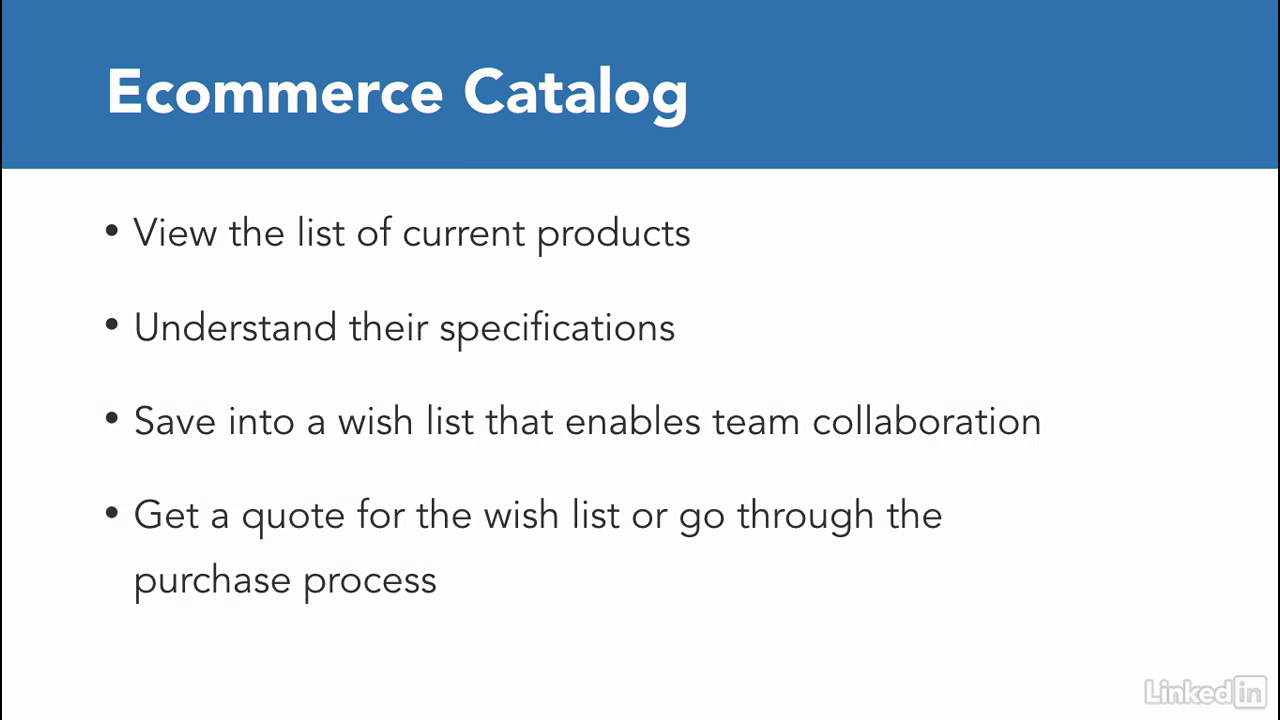
- The purpose of the application was to build the e-commerce catalog which allowed customers to view the companies products and understand their specifications.
- Customers would save products into a wish list that they could share with others on their team.
- They could also get a quote for products on the wish list.
- And go through the purchase process once they're ready.
- I'll use this e-commerce example for a monolith because it's near and dear to me and it's also a fairly common used case.
Three modules
- At it's core, the monolith had three main modules.
- The user module. Which is responsible for the user management, log-in and profile management.
- The catalog module. This module will contain a list of all the products that are in the company catalog that customers can purchase.
- And the wish list module. Which is the API that the customers will use to view and create their wish list.

Our monolith
- In this case, the monolith is a single WAR file and has one or more JAR files that provide all the core functionality.
- We would also have a common web tier to handle web requests and responses.
- This looks like a clean monolith already.

Soup-based architecture
- In your universe, you could have a clean architecture or you can even have a soup-based architecture where you just have code organized in random folders and packages.
- Hey, don't laugh. This totally happens and legacy code is really scary.
- So the question is, how can we break this up?

Break this up
- There are many ways to do this.
- And we'll use the simplest approach.
- Let's break up the monolith into it's core functionality.
- This gives us three sub-applications or microservices which are authentication, wish list and the catalog operations.
The bebefits
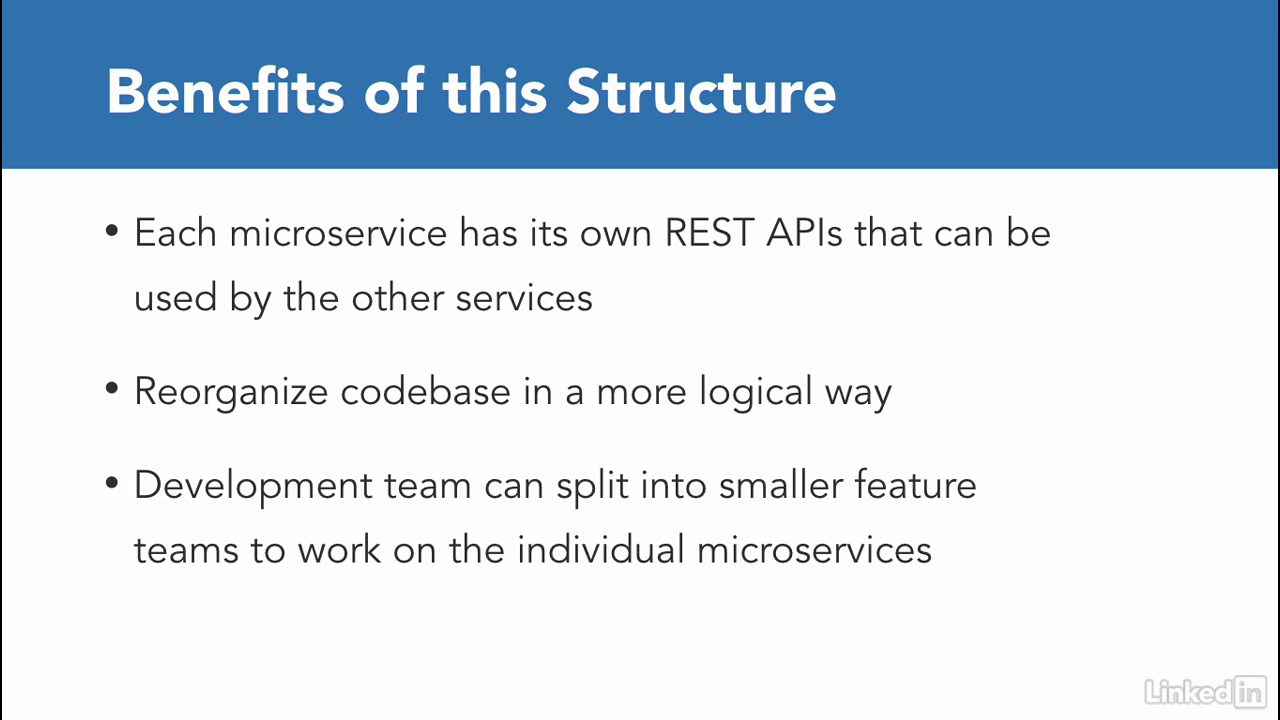
- In the real world, each of these will have a REST API that can be used by other services if necessary.
- This allows you at the initial benefit of being able to reorganize your code in a more logical way.
- The development team can rally around new architecture and split themselves into smaller feature teams to work on the individual applications or microservices.
The bebefits
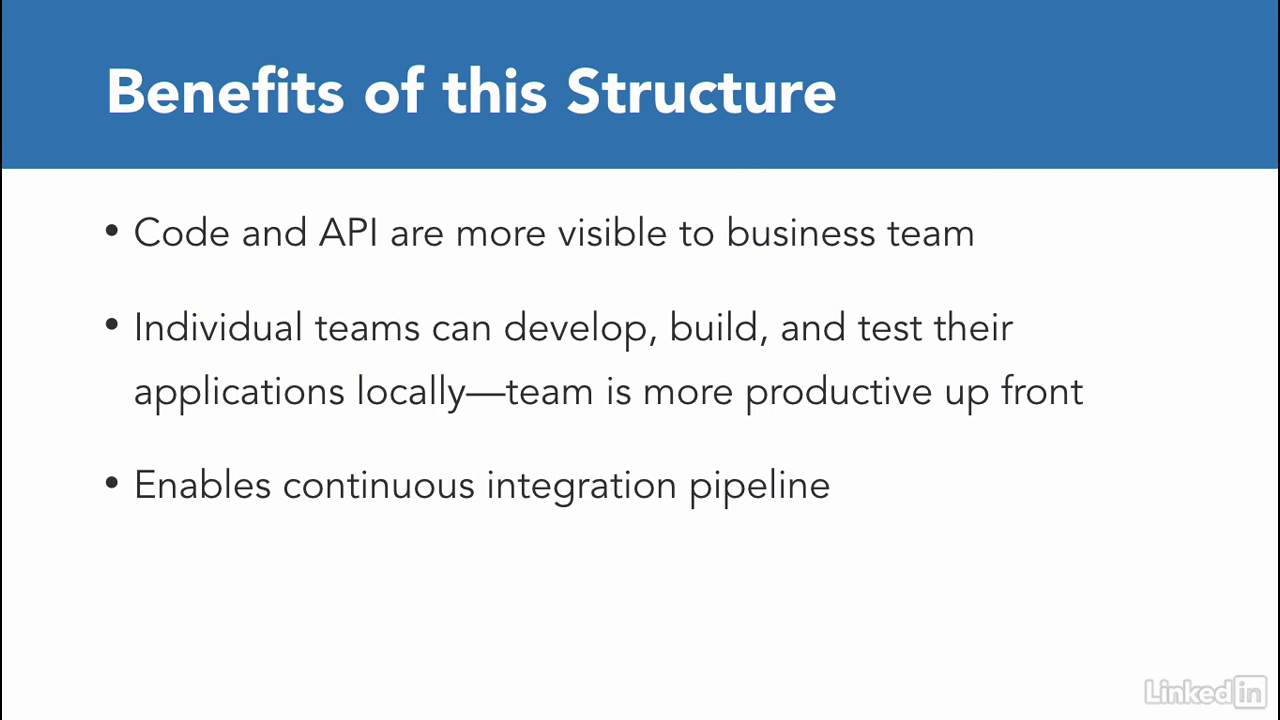
- Similarly, you might be able to convince your business team to rally around the new architecture as well.
- Because it makes the code and API more visible to the business users.
- Now that we have our microservices, we'll deploy them as containers.
- There are a couple advantages to this.
- First, the individual teams can develop, build, and test their applications locally.
- This allows the team to be more productive up front.
- The art team can work on the art features.
- And the wishes team can develop their wishes components individually.
- Second, you can setup a continuous integration pipeline for every time you make code commits to your repository, you can also run a CI job to test a code and then finally push your containers.
Containers
- Containers also end up allowing you to use Kubernetes.
Transitioning from monolith to microservice
- Also, by transitioning from monolith to microservice, we've addressed the microservice building block concerns and applied the basic principles form the 12 factor design.
- For the purposes of this demo, we'll populate our applications with representative code rather than actual code allowing us to focus on the architecture and infrastructure.
Lecture 012 - Microservice deployment to Kubernetes
Three modules on github
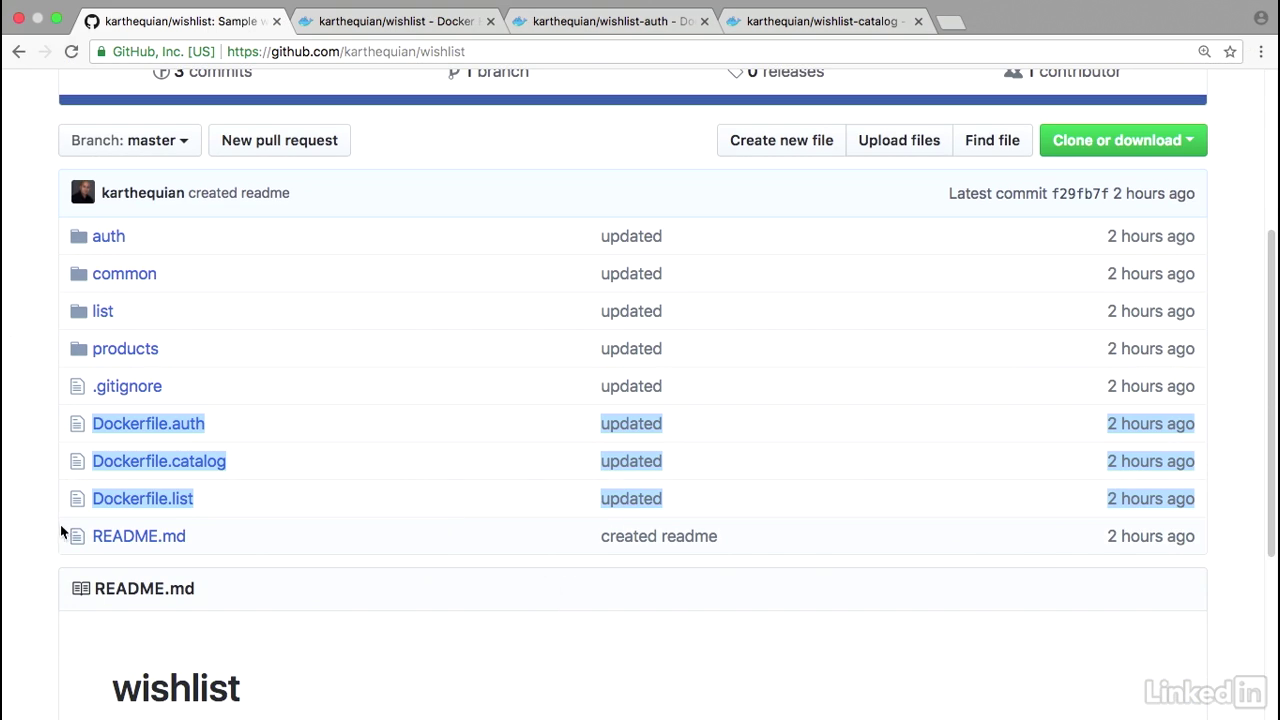
- We have our sample application called wishlist and GitHub under karthequian wishlist.
- You'll notice that there are three docker files associated with this.
- Also it has the source code for the actual application.
- If you go to docker hub, the three docker hubs are under karthequian wishlist, tagged as 1.0.
- Also, wishlist-auth right there.
- Tagged as 1.0.
- And then wishlist catalog, also with a tag of 1.0.
Our deployment
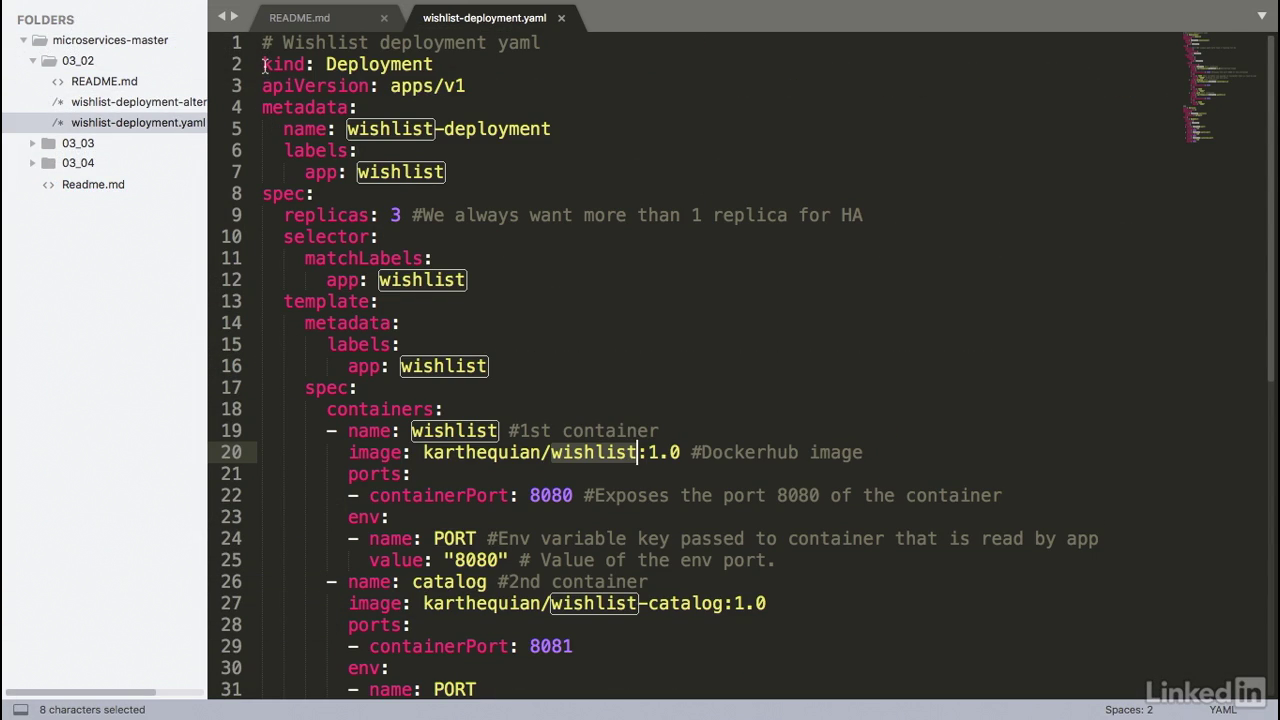
- So this is defined in a yaml file and we have the deployment portion.
- We see that this is a kind of deployment with an API version of apps v1 with some metadata.
- Also the spec portion has a replica count of three.
- You want this to always be something more than one.
- If you have a replica of just one this would be in a single pod.
- And if for some reason the pod goes offline or it crashes then you'll have a brief amount of downtime associated with the deployment.
- Moving on we have selectors and the template portion of this which has metadata.
Our deployment
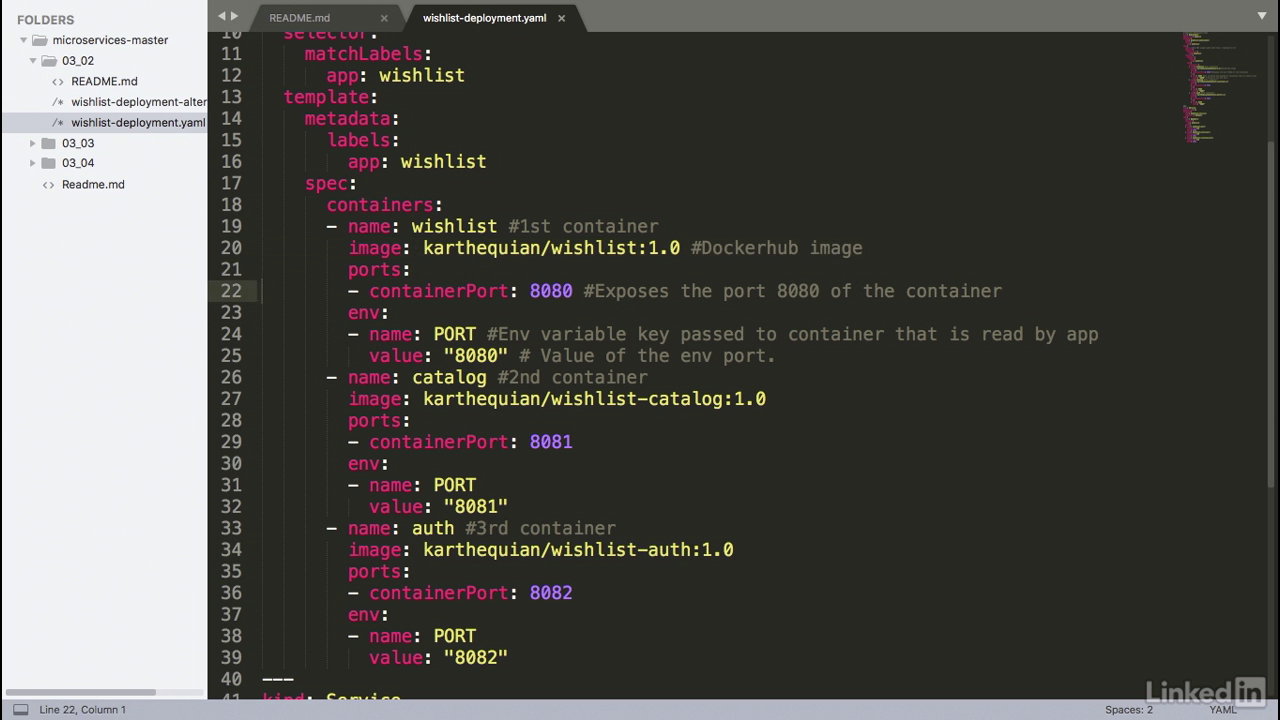
- And finally the spec portion.
- This is where the majority of our code would go.
- There are containers associated with this.
- And there's three of them.
- A wishlist container, a catalog container, and finally an auth container.
- As you can see we have the image of karthequian wishlist 1.0.
- Also wishlist catalog 1.0 and auth 1.0.
- We notice that we had ports associated with it, so we're declaring a container port of 8080.
- This exposes the port 8080 of the container to the outside world.
- And we're passing in an environment variable called port with the same value of 8080.
- This is because for this application, when it starts up, it will read the value of the environment variable called port, and whatever value is passed to it, that will be the value that the server thought the application starts up on.
- Similarly for catalog we have port 8081 and port 8082 for wishlist auth.
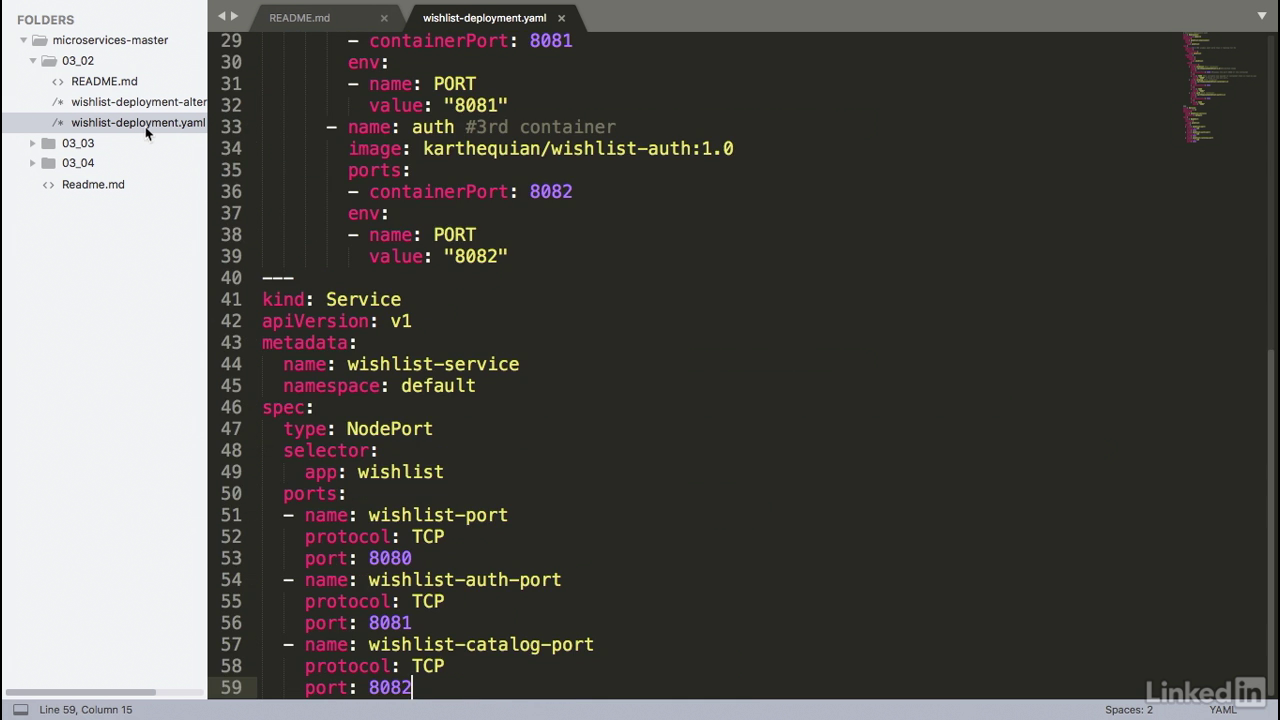
Our deployment
- The last part of this is the service.
- Notice how I've declared a service and a deployment in the same file.
- In Kubernetes you can actually define separate modules in one single file.
- So you can have one single yaml file that has all of your information for a specific deployment, service, replica set, etc.
- So in this example our service, we're going to choose a type node port, and we do this because the node port is the simplest kind of service, and Kubernetes by default will allocate a port between 30,000 and 32,767 for the service.
- So the node that you're running on will actually proxy that port to your service.
- So in this case our wishlist port is 8080.
- Also the auth port 8081.
- And the catalog port 8082.
- When we run this example we'll notice that these three ports will be mapped to Kubernetes specific ports in our yaml.
So let's take a look and see how this is running.
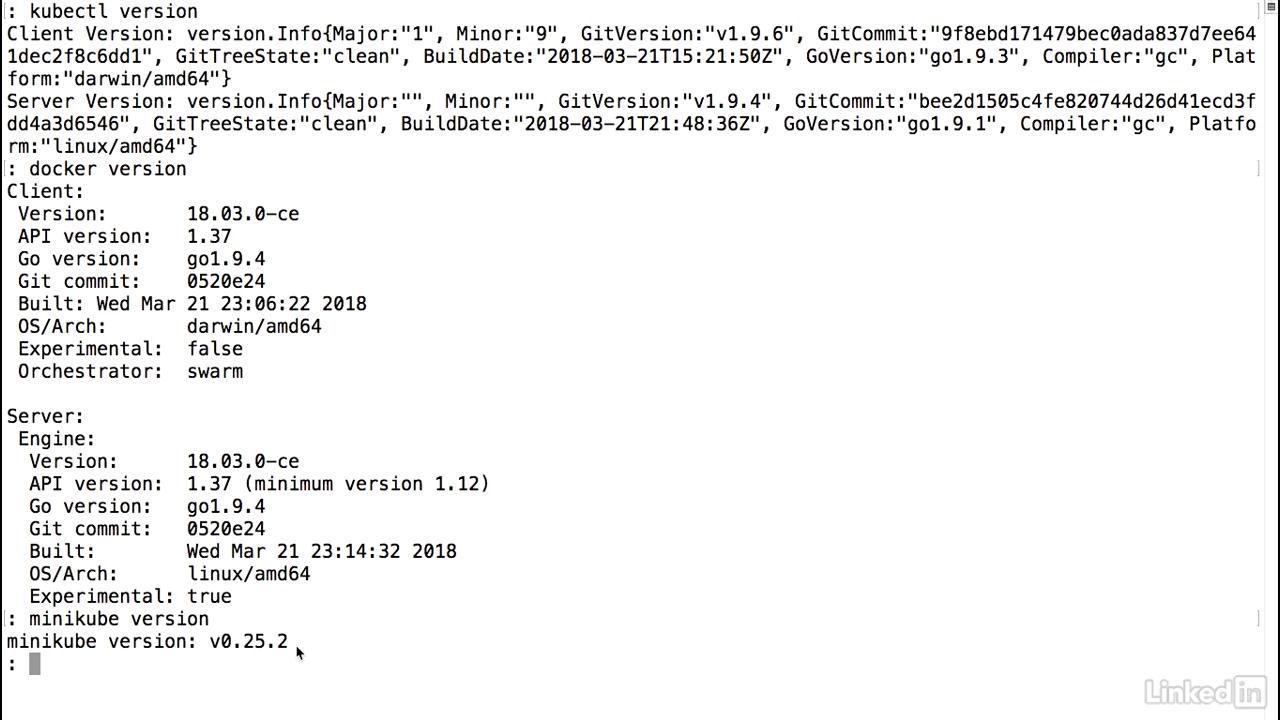
- Before I do this I'm going to check the versions.
- So I'll have kubectl version.
- For the server I'm running Kubernetes 194.
- For docker version I'm running 18.03.0-ce.
- Same thing for the server.
- And for minikube I'm running minikube version 25.2.
- So this is a good time to mention that if you don't have either of these three pieces you'll probably want to get docker, kubectl, and minikube on your system.
- All right, now let's go ahead and actually deploy our service.
Create
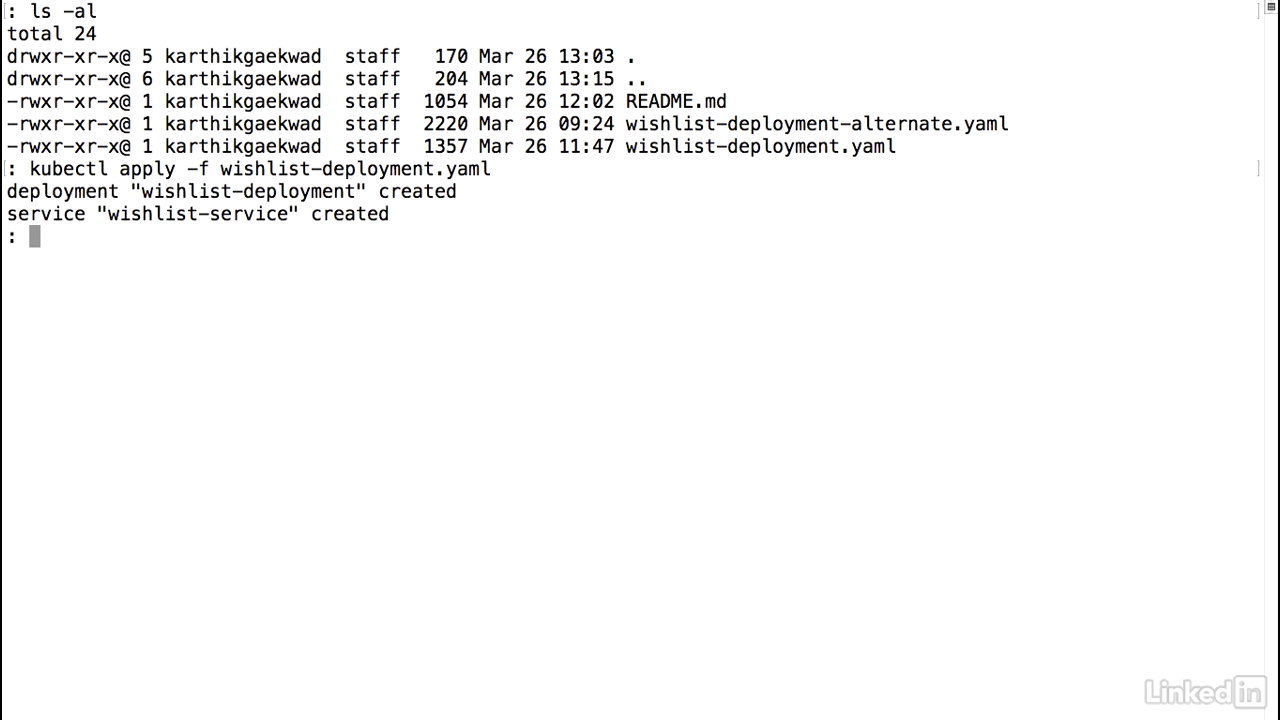
- Make sure I'm in the right directory, ls minus al.
- Everything looks good.
- So I can run the kubectl apply command.
- And I'm going to pass a file called wishlist deployment.yaml.
- Run this.
- And we'll notice that this says deployment wishlist was created.
- And also the service was created.
See the result
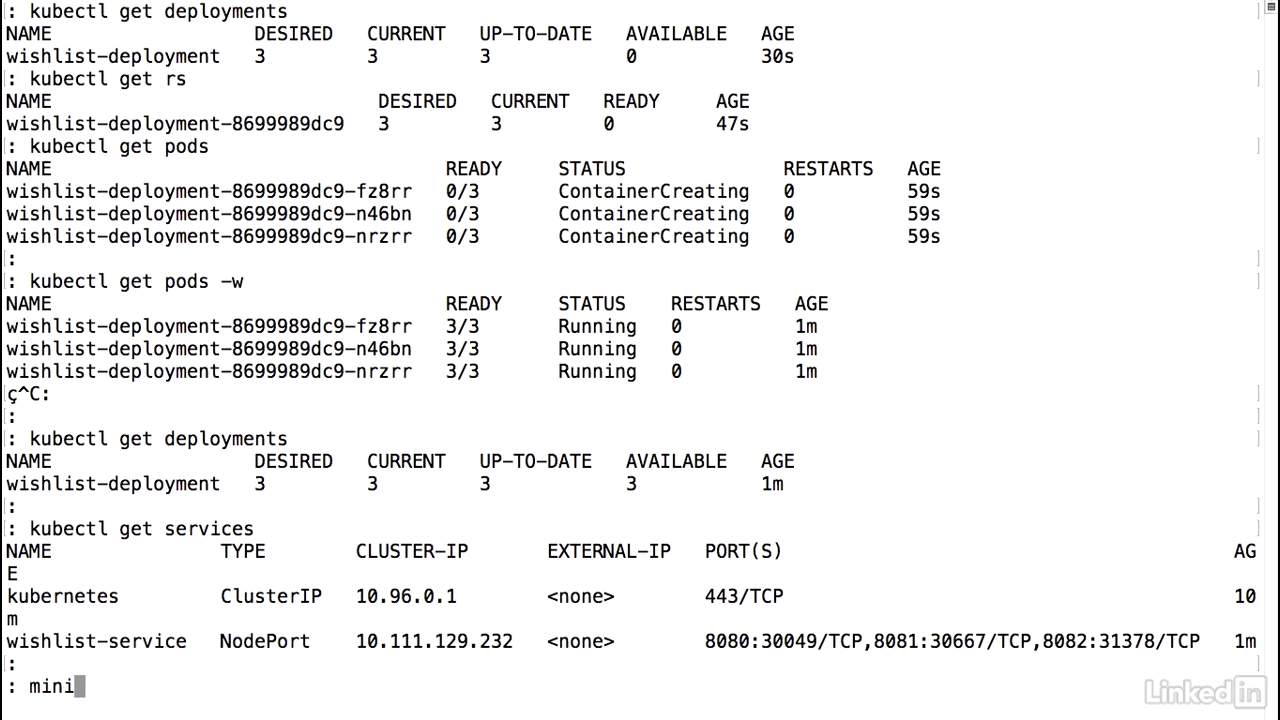
- So let's take a look.
- Kubectl get deployments.
- We'll notice that the desired count is three.
- It's not available yet because it's probably pulling the image for the pods.
- So let's use a little bit more introspection.
- Kubectl get replica sets or rs.
- That's the short form for it.
- Also desired, and it's not ready yet, and finally let's take a look at the pods.
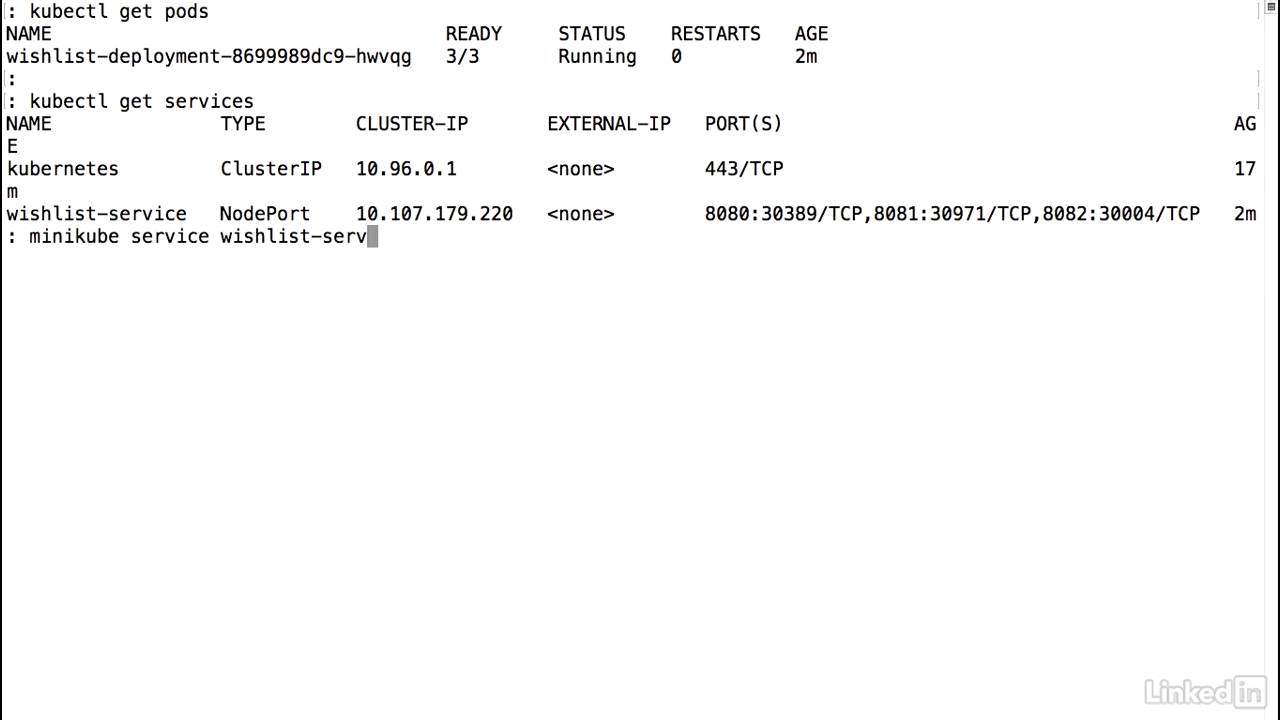
- Get pods.
- We notice that we're seeing a container creating status.
- So let's actually watch this and oh, by the time I ended up watching it, we noticed that it went to a running state.
- Now let's go ahead and look at our deployment again.
- And we notice that desired three, current three, and available three.
- This is different from what it was before where it said available zero, and that's because all of our pods are online.
- Things are looking good so far.
- Let's take a look at our service.
- And as I'd mentioned before, Kubernetes automatically maps specific ports to the individual container ports that we were running for the pod.
- So it looks like from our perspective now everything's up and running.
View result
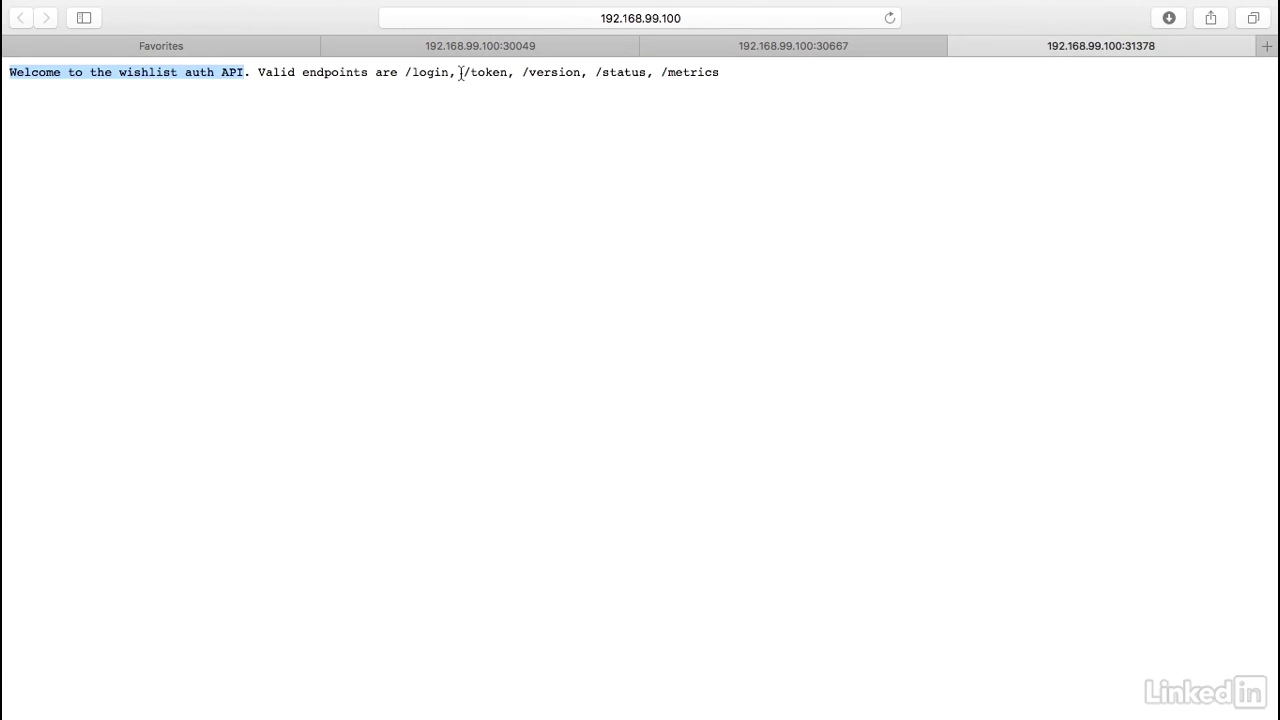
- Since I'm running in minikube I can do a minikube service and I can take the wishlist service.
- This command will bring up my default browser and we'll notice here that this is the entry point for the wishlist auth API.
- This is the entry point to the wishlist catalog API.
- And finally, this is the entry point to just the wishlist API.
- So it looks like our application is up and running as well.
Lecture 013 - Alternate deployment YAML
First example
- In our first example we notice that we had a single deployment and a single service.
- Our single deployment had a template with multiple containers running in them, one for wishlist, one for the catalog, and finally one for auth.
- The question is, is the only way we can accomplish this problem?
- Truth is, Kubernetes is really flexible, and we can do this in multiple ways.
- Let's take a look at the other way.
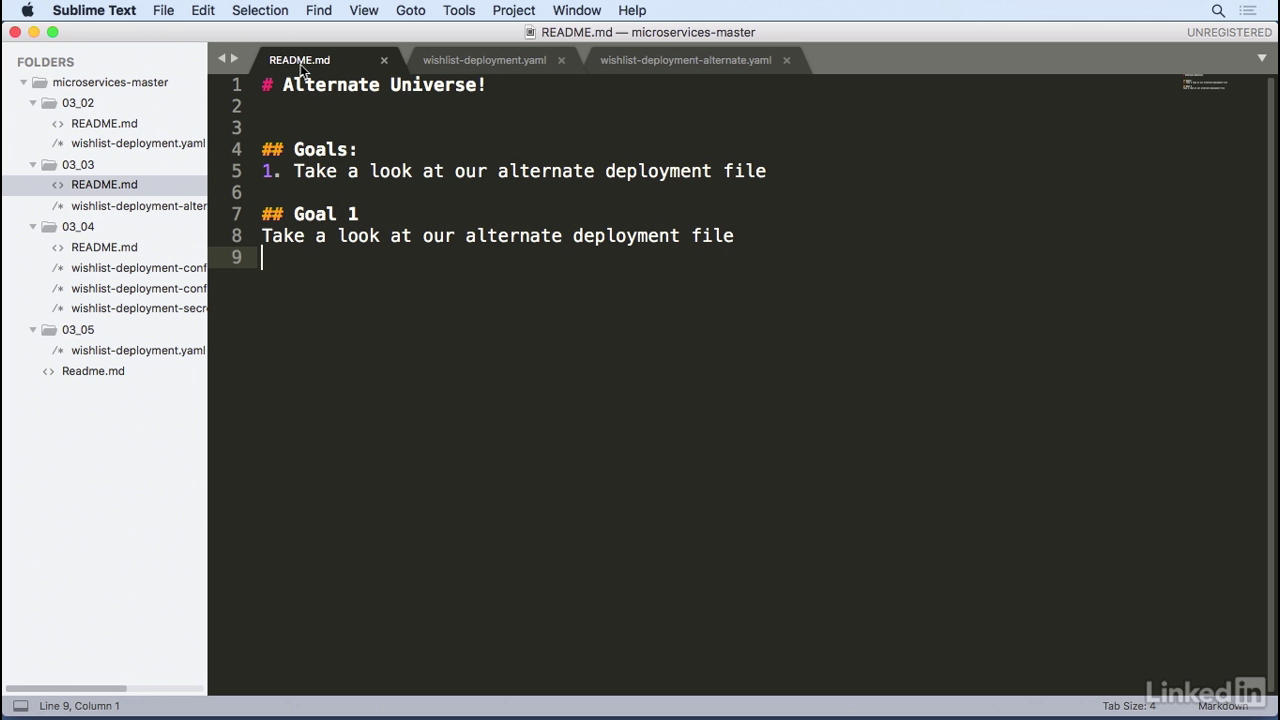
Another way
- In this scenario I'm actually breaking up the deployment into three individual deployments, and I'm still using the same service.
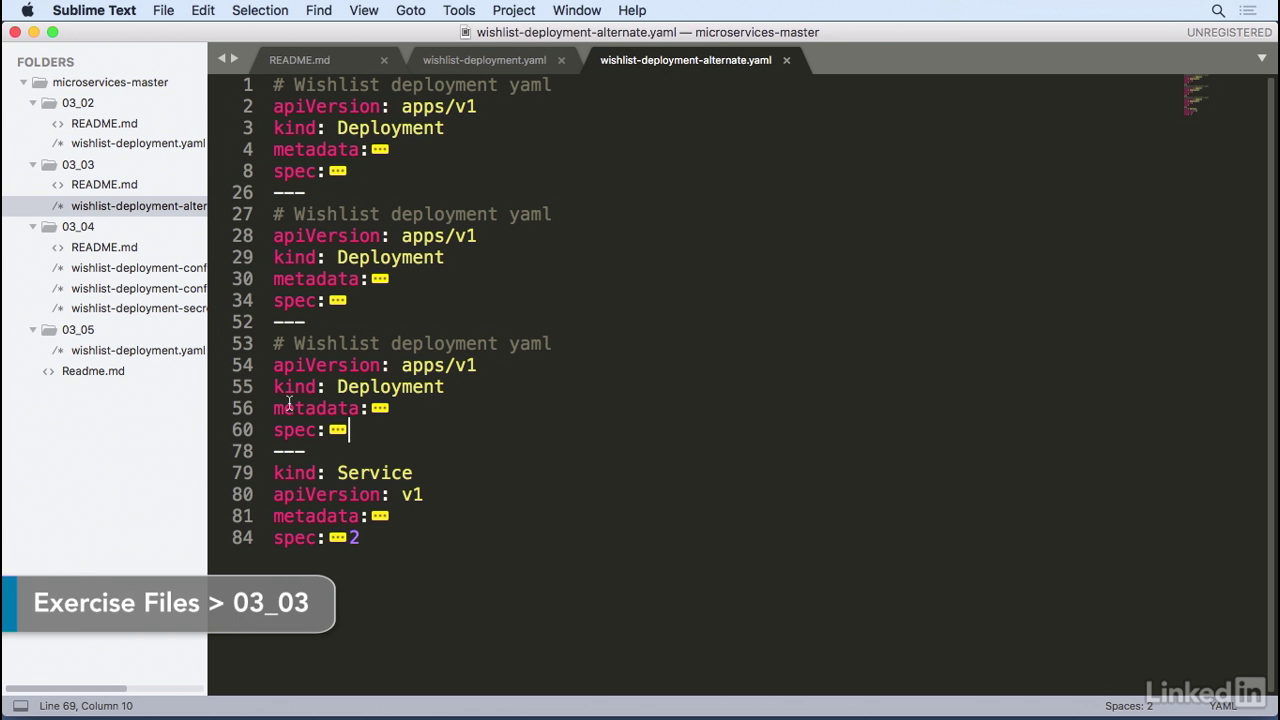
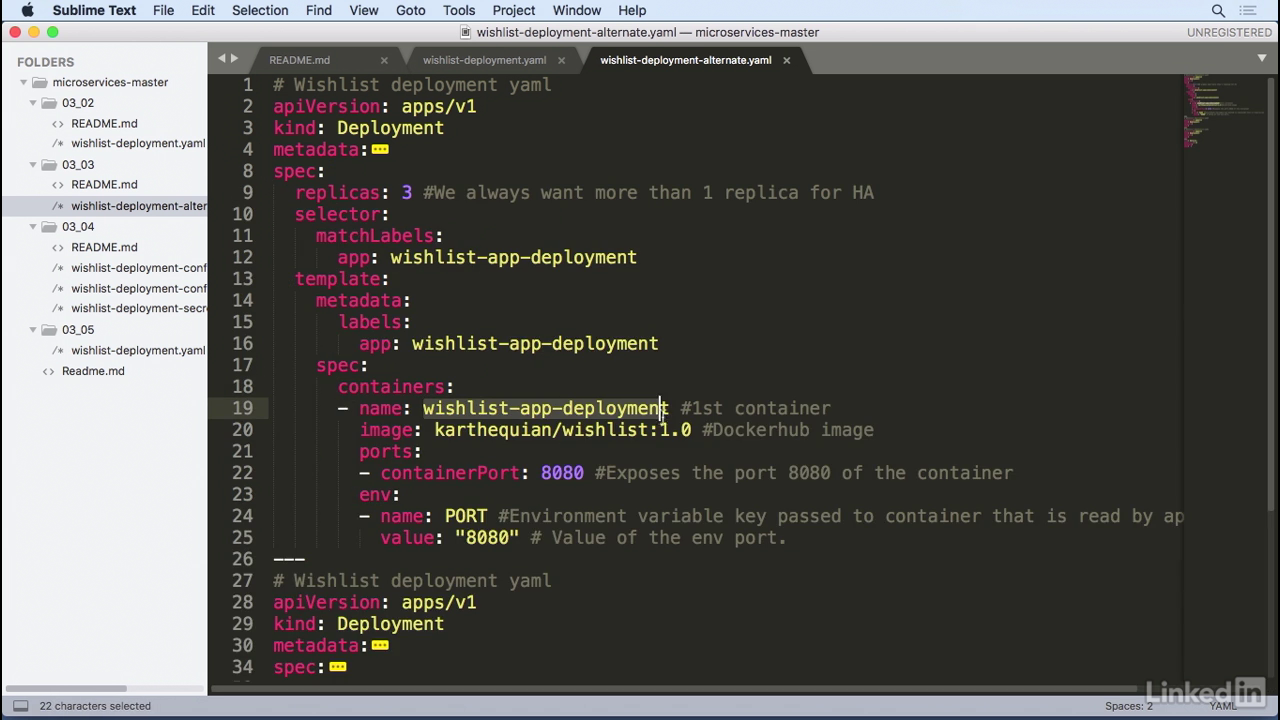
Another way
- However, if you look at the deployment, you'll notice that in the spec there's only a single container.
- This is the wishlist app deployment container backed by the same image as before and the same port.
- Similarly we have the same container for the catalog, and also another deployment for the auth.
- The question here is, why would we want to use three deployments versus a single deployment, and which one do you choose in what scenario?
- The answer to that is, it depends.
- I've seen larger organizations that have individual teams or large teams work on individual deployments.
- So, it makes it easier for one team to take ownership of a single deployment.
- Let's say you had a wishlist team.
- They could actually own this entire deployment for wishlist, and deploy it as one unit.
- On smaller teams or smaller organizations, when you want to encompass everything as a single application, you'd probably end up using one deployment for your app, and treat wishlist as an application that you want to deploy as one unit of work.
Run it
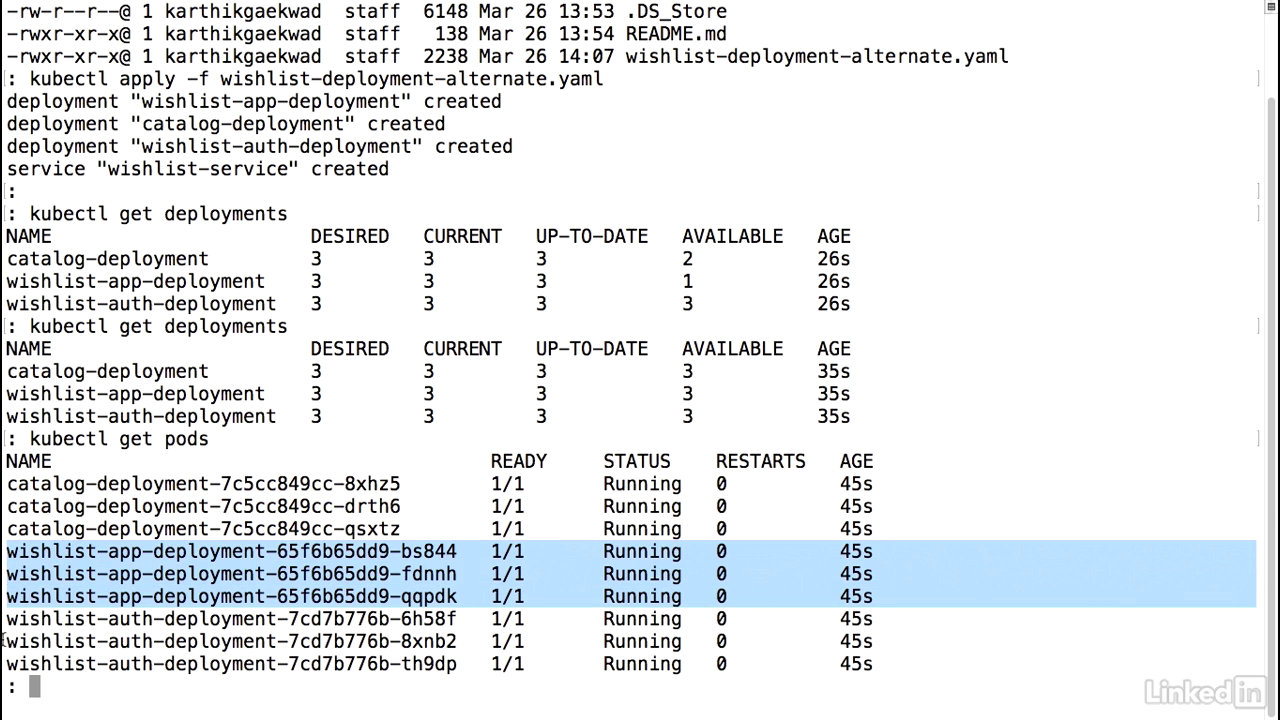
- We'll run the kubectl, apply, minus f, wishlist alternate deployment, and it's created three deployments.
- If we take a look at our deployments, we'll notice that we have three of these.
- It looks like one of these hasn't come up yet.
- Actually catalog has not come up yet, as well.
- Taking a quick look again.
- All right, that's all three of them up and running.
- Now, if you'll look at the actual pods associated with this, we'll notice we have a lot more pods.
- We'll have three pods for each of the deployments associated, because we had specified three as a replica set earlier.
- And there we have it.
Lecture 014 - Adding context with configmaps
About configuration
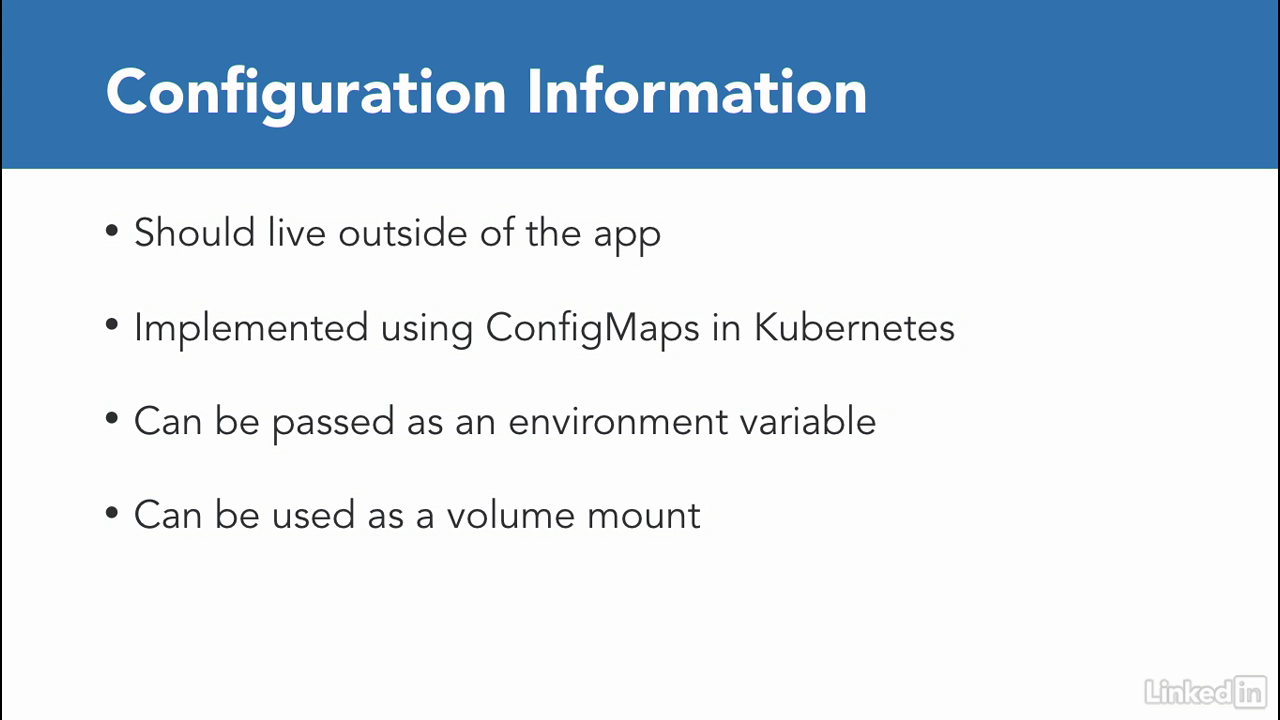
- Configuration Information should live outside of the application.
- How can we do this in Kubernetes and how is it implemented?
- Kubernetes gives us a construct called ConfigMaps that helps us implement this feature.
- There's two ways to do this, either you can pass in data via environment variables for small sets of data or for larger pieces of data you can use it as a volume mount.
Config maps
- In the simple scenario in this example I have a configmap a time configmap EPI version v1 and we're going to call it log-config and the actual data associated with this is log-level of debug.
- So this is the definition of the configmap now when we want to execute this in the container we first need to volume mount that, so we put volume of config-volume and configmap with name of log-config, which is the information that we had pulled in before.
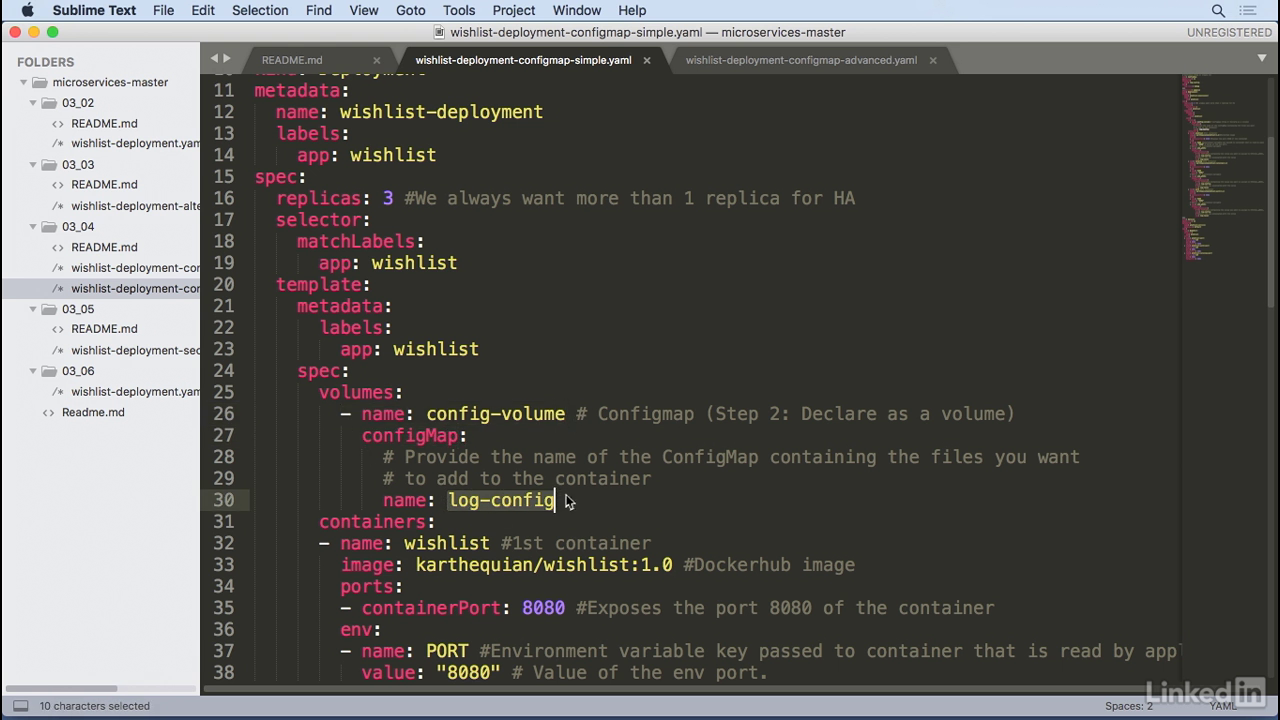
Env
- And to see this inside of the container, we're going to pass this in as an environment variable, we'll call it log-level and the value comes from configmap keyref and the name of this is log config which is the same as the configmap from the volume.
- And finally the key log level which comes from the actual log level of debus from the configmap.
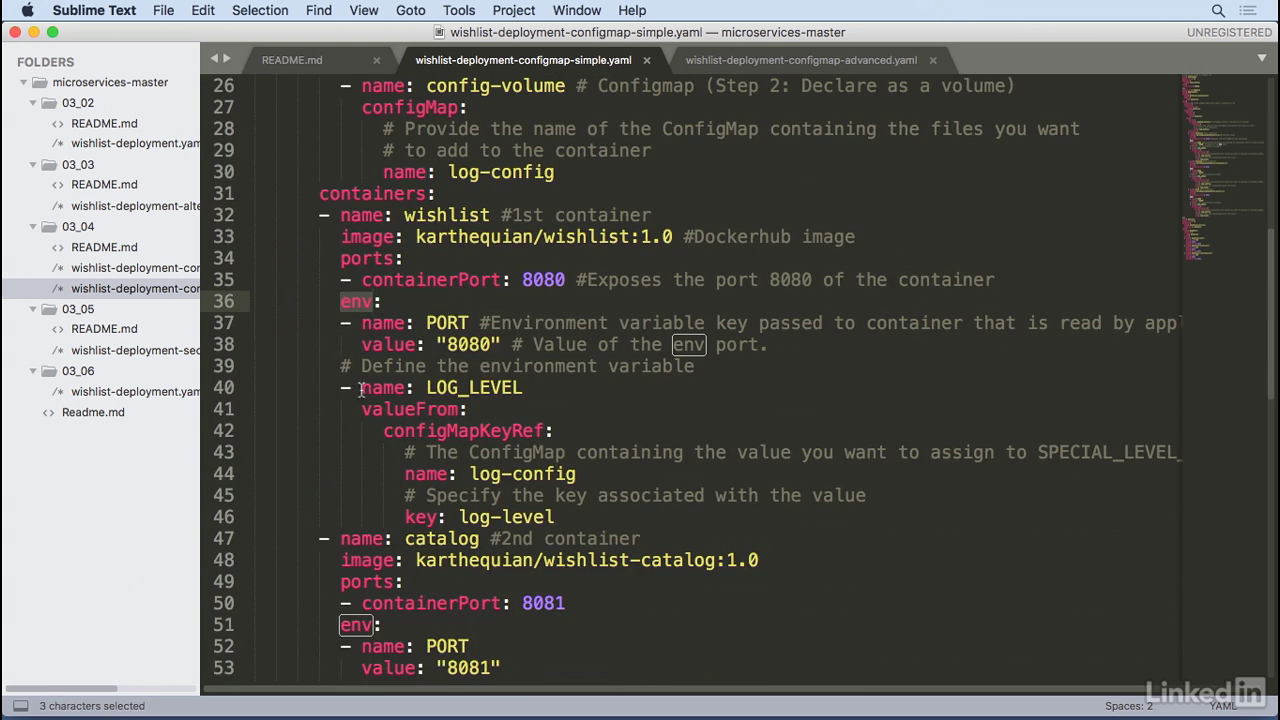
Running
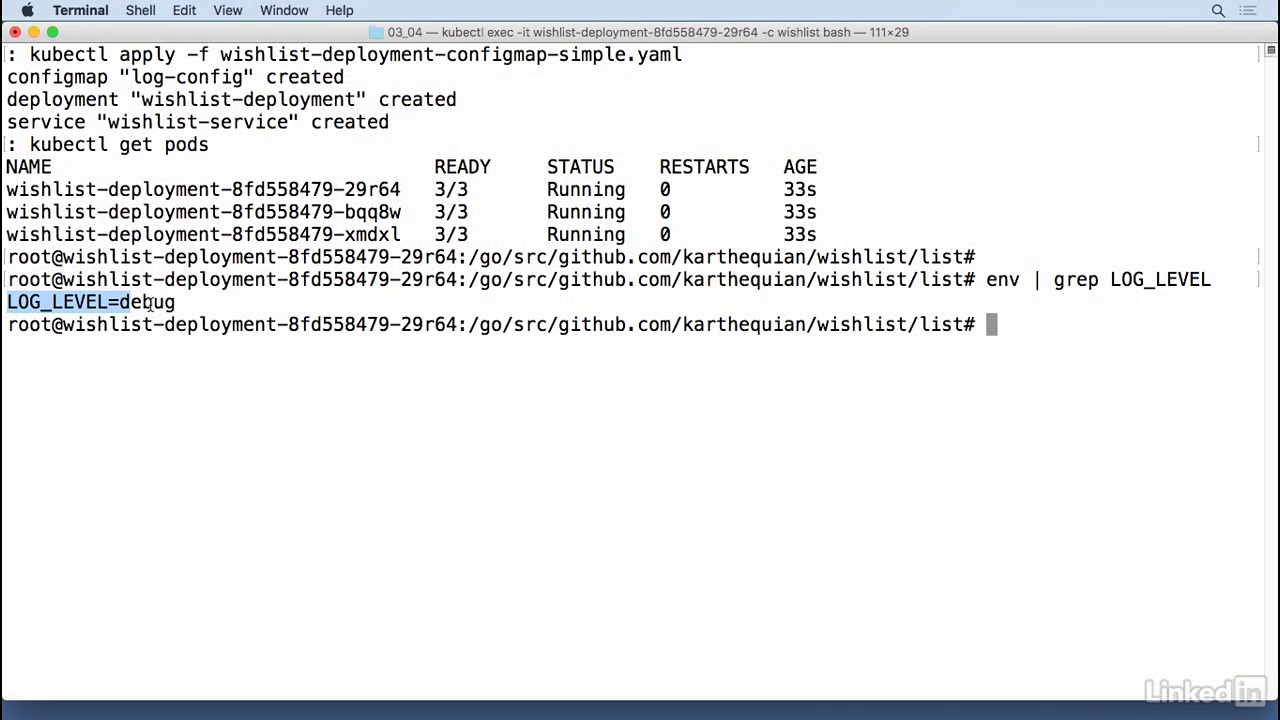
- To run this kubectl apply minus F wishlist configmap simple, configmap is created, good deployment is created and so was the service.
- I was running this in the wishlist container I believe, so if I do a kubectl get pods I'm going to pick the first pod, kubectl exec minus IT and then I'm going to exec into the wishlist container.
- And do it as bash.
- And right now I'm in the container so I could do an env grep and to pull the value it was called log_level.
- So there we have it log level of debug running in my container that came from the actual configmap that we had configured.
Multiple properties
- So that's great for simple cases but what do we do in larger scenarios where we want (mumbles).
- Java for example has a log (mumbles) properties where you use log for J for properties, we have a lot more content that needs to come in via a file.
- How would we do this with a config map?
- It's very similar, so when we declare configmap in our data section we declare the file colon space and then we have a pipe and then after the pipe we put the actual contents of what we want to see.
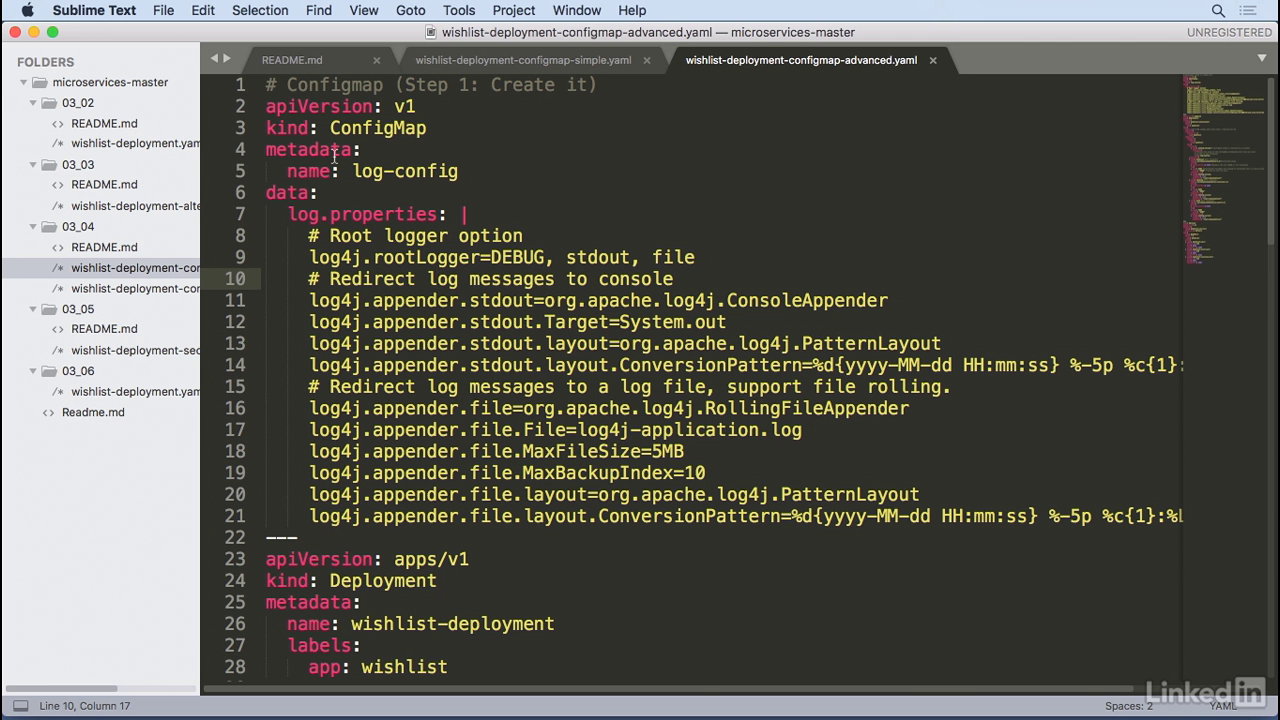
Multiple properties
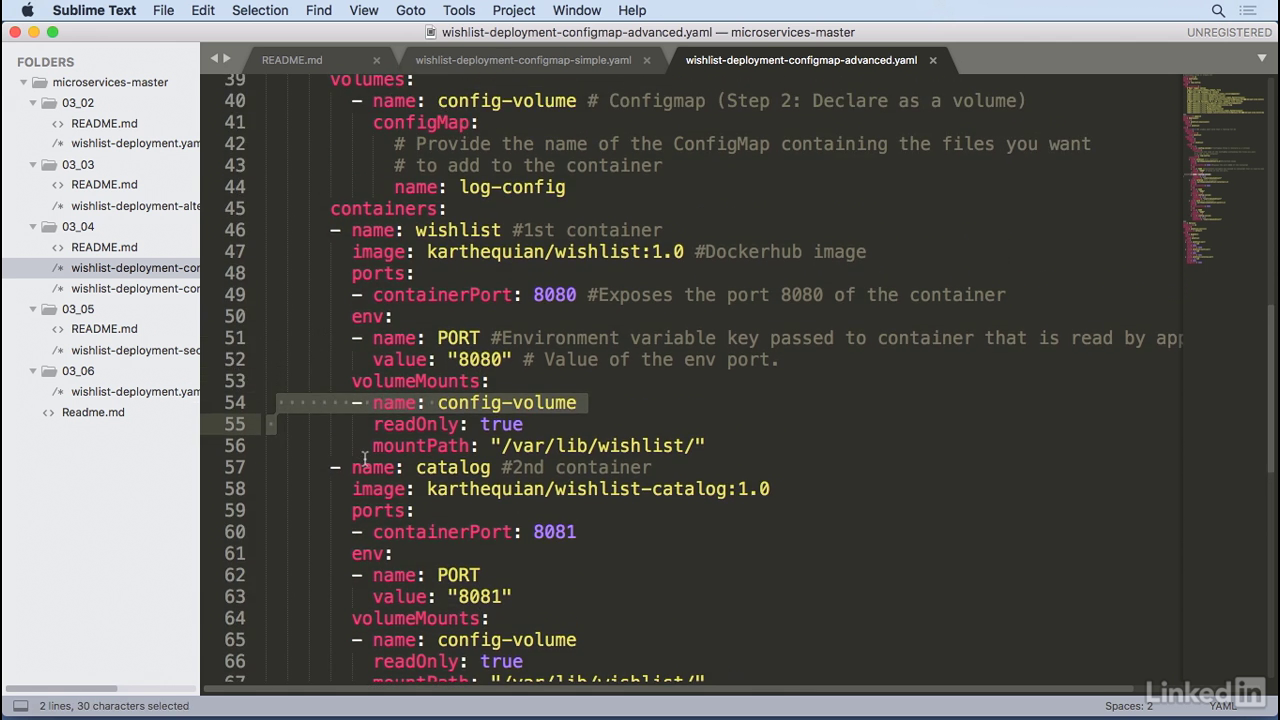
- And then in our template definition in our spec we have the volume like before.
- A log config, which maps the betadata to configmap.
- And in our container we have a volume mount with name of config volume that's similar to the actual volume that we had before, we're going to set this as read only of true because we don't want to overwrite the file and then we're going to mount this in a path of var lib wishlist.
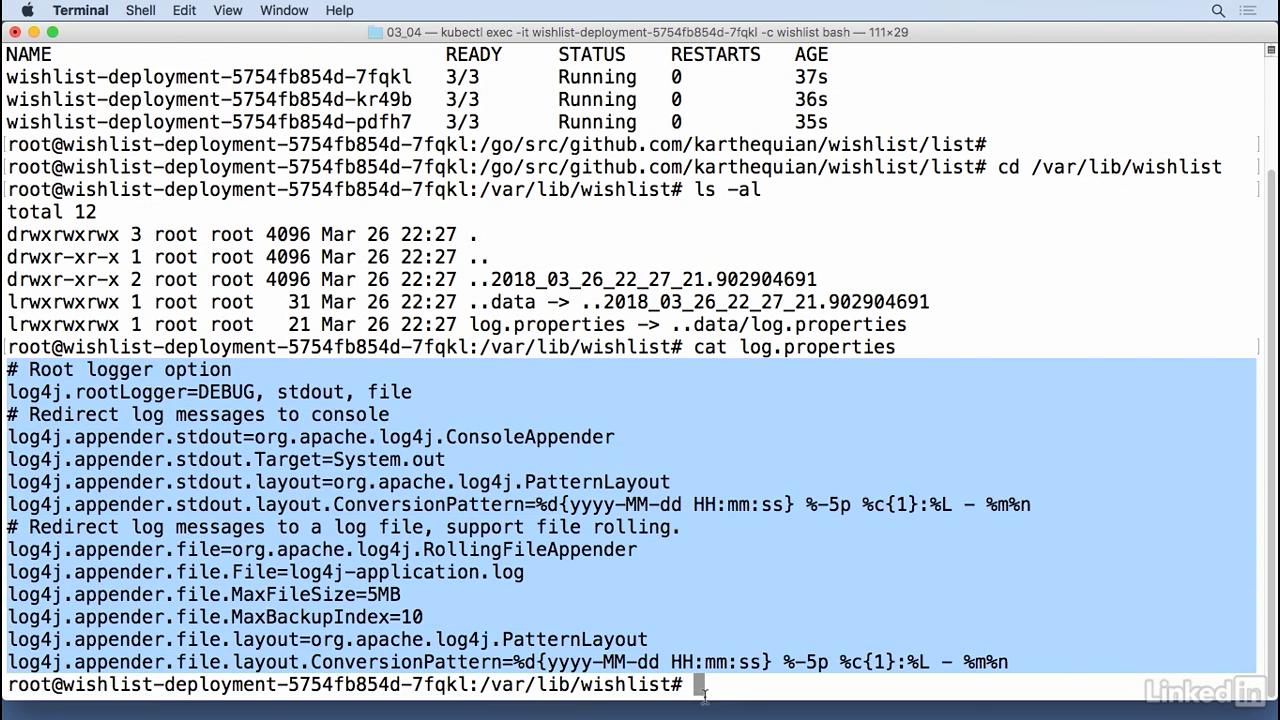
Command to access container
- This pic is a portion of pic below
Run this
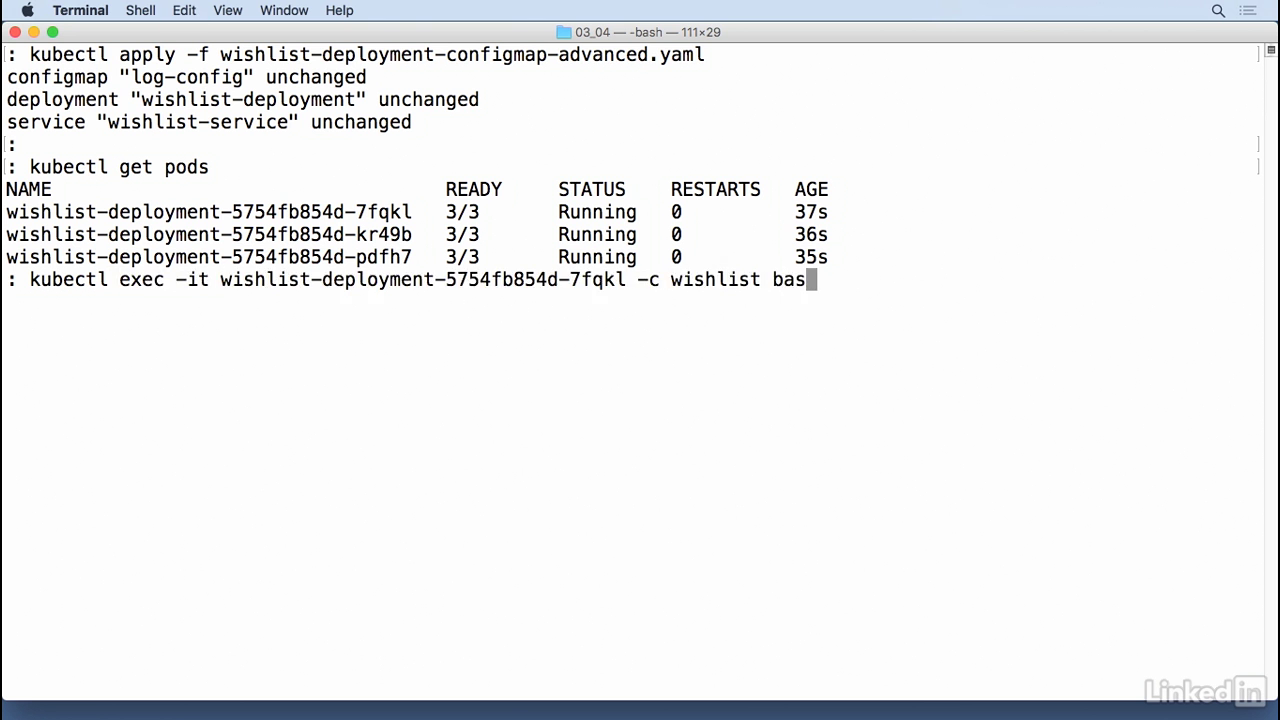
- Kubectl apply minus F wishlist configmap advanced, so I can do a kubectl get pods, I'm going to pull the first pod kubectl exec minus IT the wishlist container bash.
- So now in this case I'm running inside of the container and I have this mounted in var lib wishlist so that's cd var lib wishlist.
- And here you'll notice you have a log.properties so you count this out.
- We noticed that the value is the actual value of the file.
- So in this case we're in the container again and we have a file that we put in a specific directory called lib wishlist that's the contents that is coming from your log.properties that's loaded in as configmap.
Lecture 015 - Working with sensitive configuration
The problem
- I got a secret to tell you. It's SEk=.
- You'll have to base64 it, decode that, to actually get it.
- Let's talk about secrets real quick.
- Secrets are very similar to config maps, but they're base64 encoded, so you can't actually see them when you try to get them via kubectl get secrets.
- We can pass these the same way as we did for config maps, either by in environ variables or volume mapping a file, in the case where you might have to upload a cert in to a container, for example.
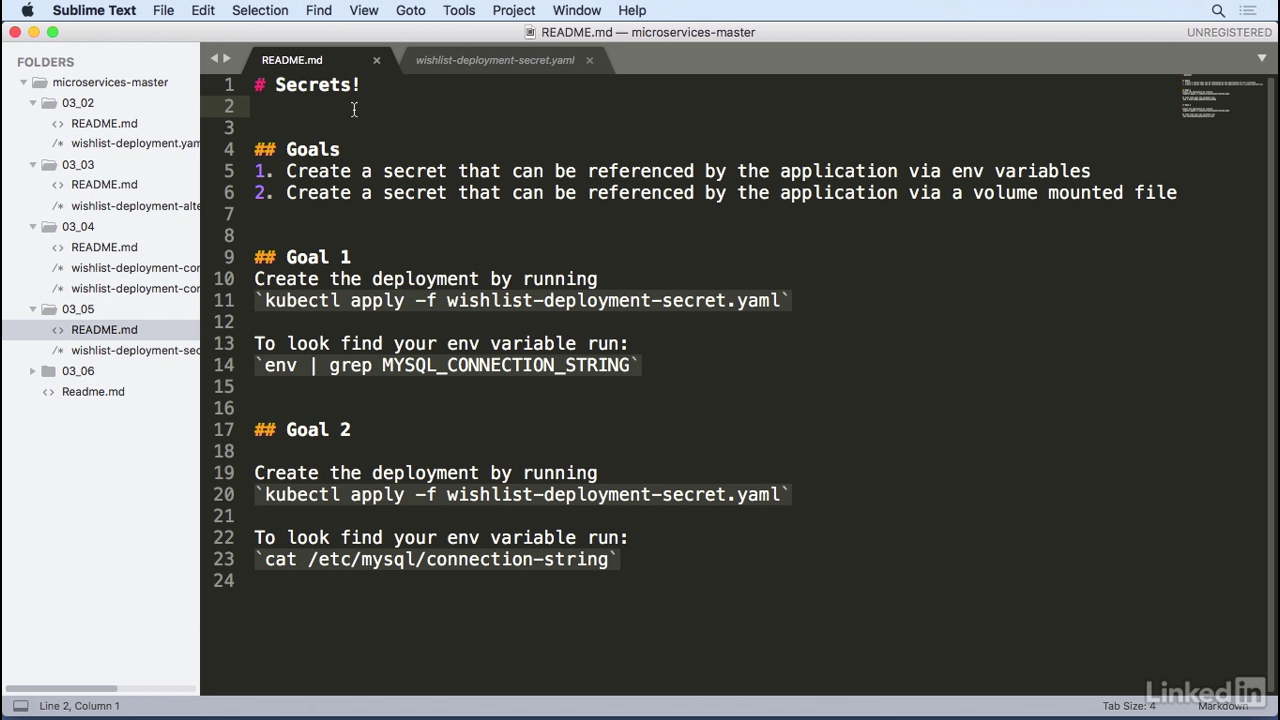
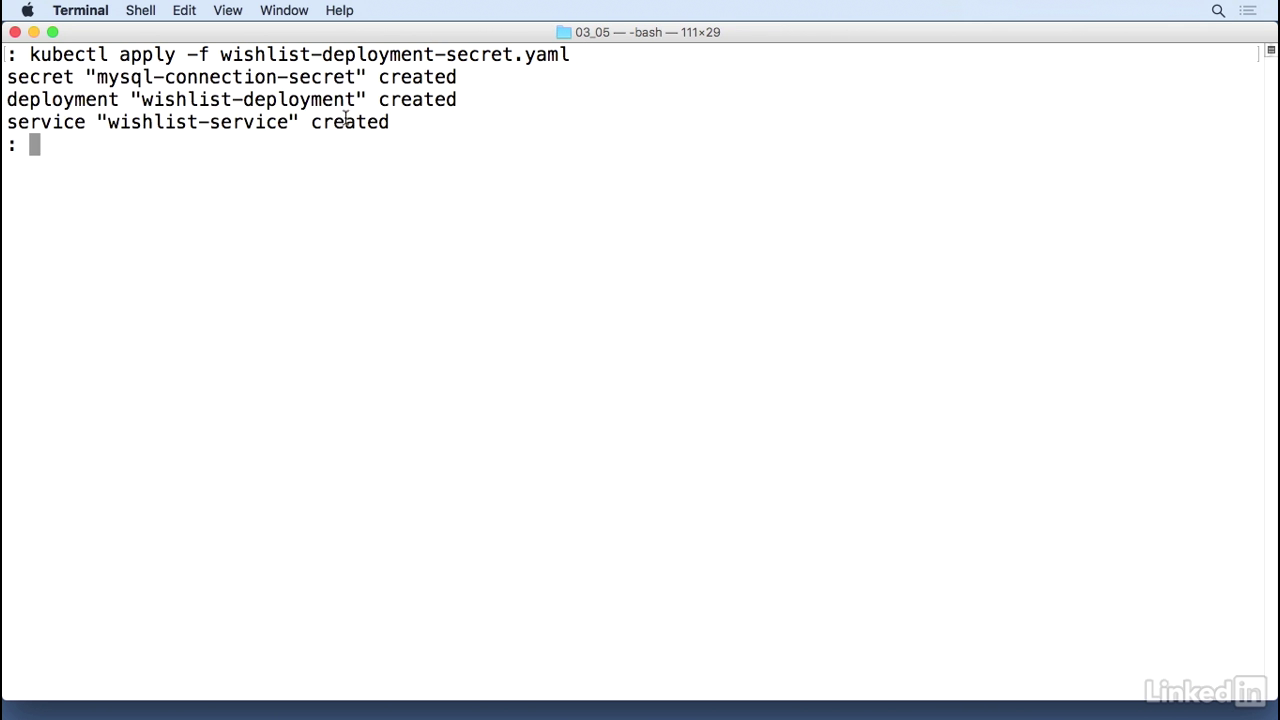
Run app first
- Kubectl apply, minus f.
- Wishlist secret deployment, or deployment secrets.
- So while this is creating, let's take a look at what we're actually trying to do.
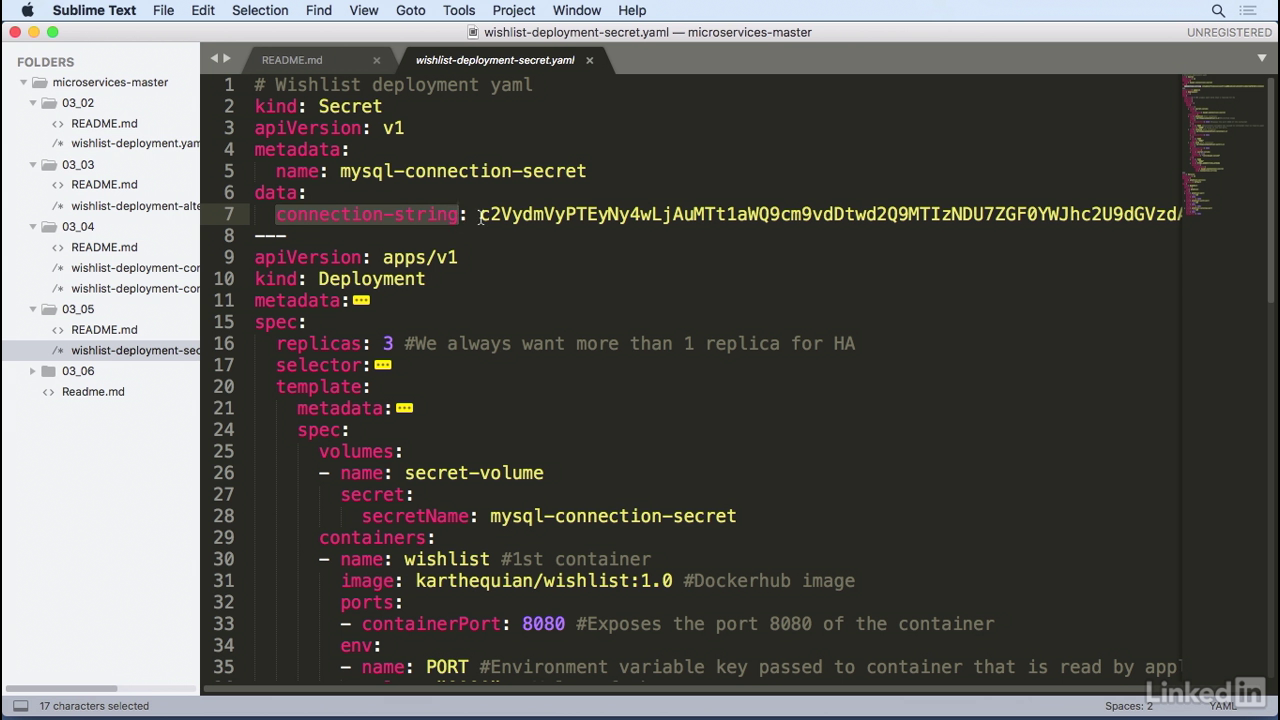
Our yaml.
- You'll notice that there's a kind of secret similar to a kind of config map, with a data section and then a connection string with some garbled data.
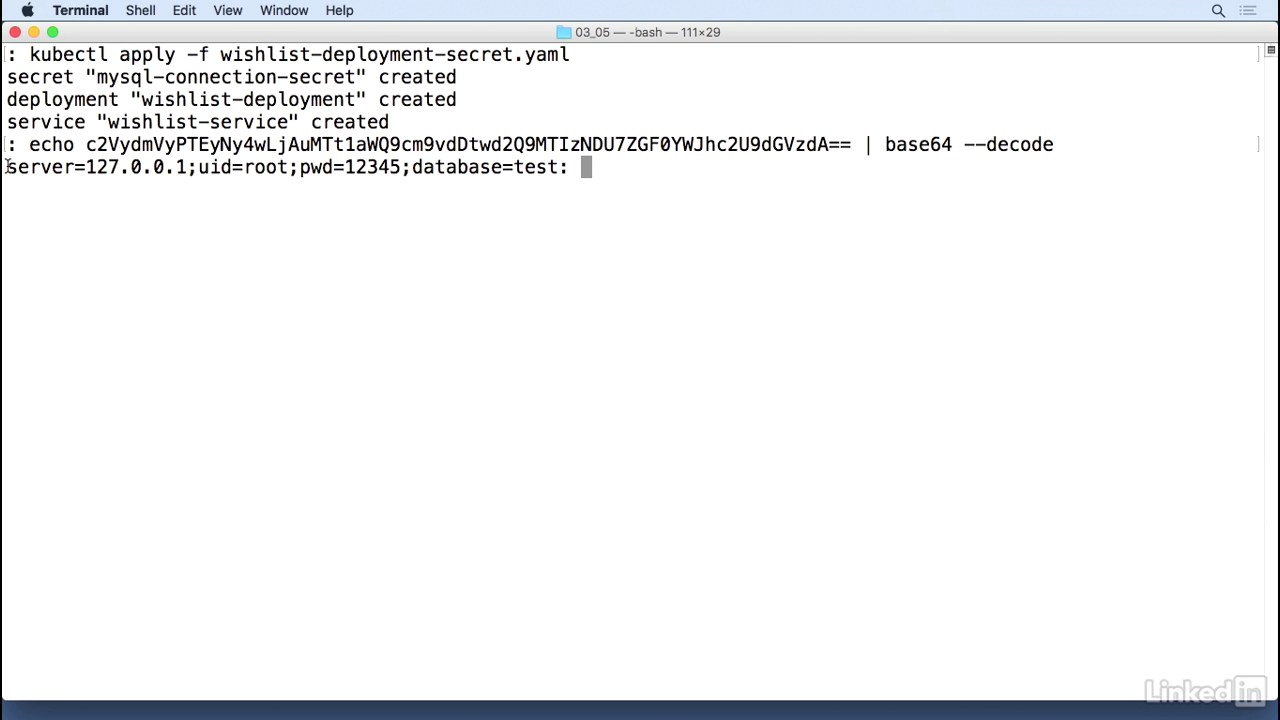
View it
- So if we take this and we run echo, the value, and base64, decode.
- We actually get back the true value of what that was supposed to be to begin with.
- SO this looks a lot more like a mySQL connection string.
- So how does this make it into the container?
Secret-volume
- So we have a mySQL connection secret, and this gets mounted in by a volume, much like config maps.
- So we have the secret volume, and then the secret name.
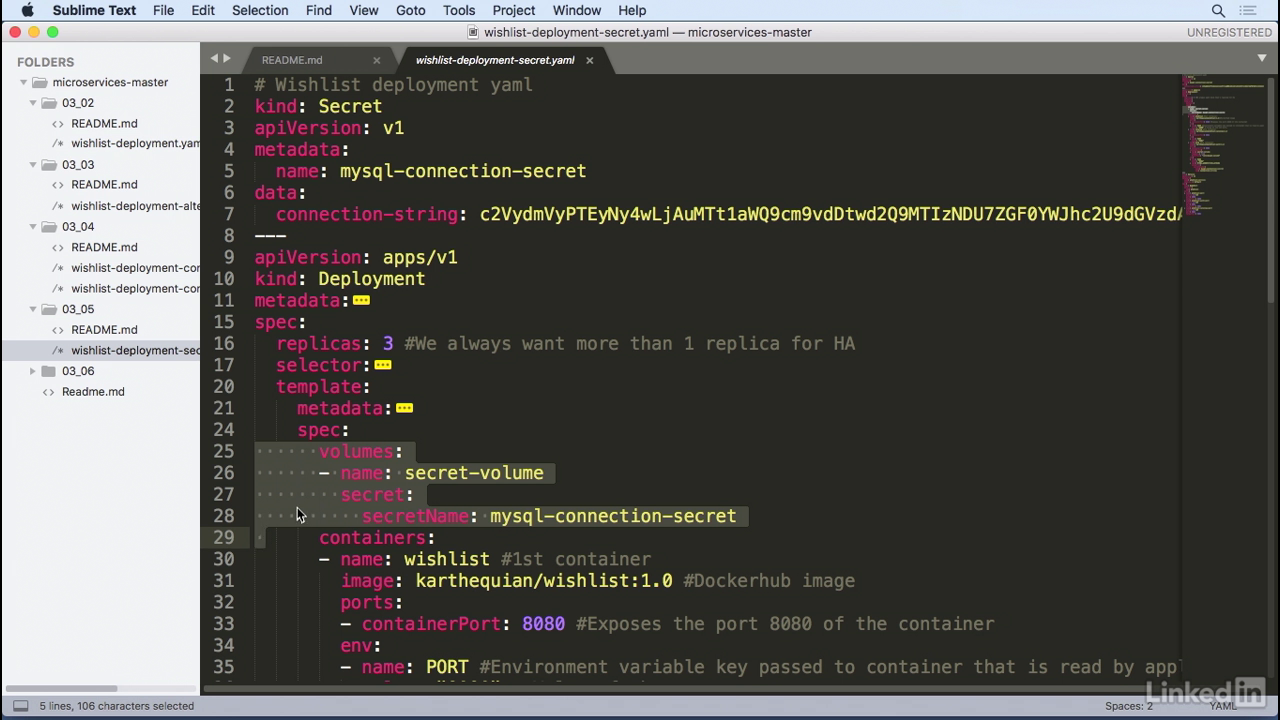
Use secret
- And as we go through our containers, in the auth container we have volume mount with name of secret volume, which corresponds to the volume we had above.
- And in this case we're setting read only to true, meaning we only want to read that, and we're mounting that into a specific path.
- Etc/mysql-volume.
- So in this scenario we're actually volume mounting whatever was in the secret name of mysql-connections secret.
Use secret
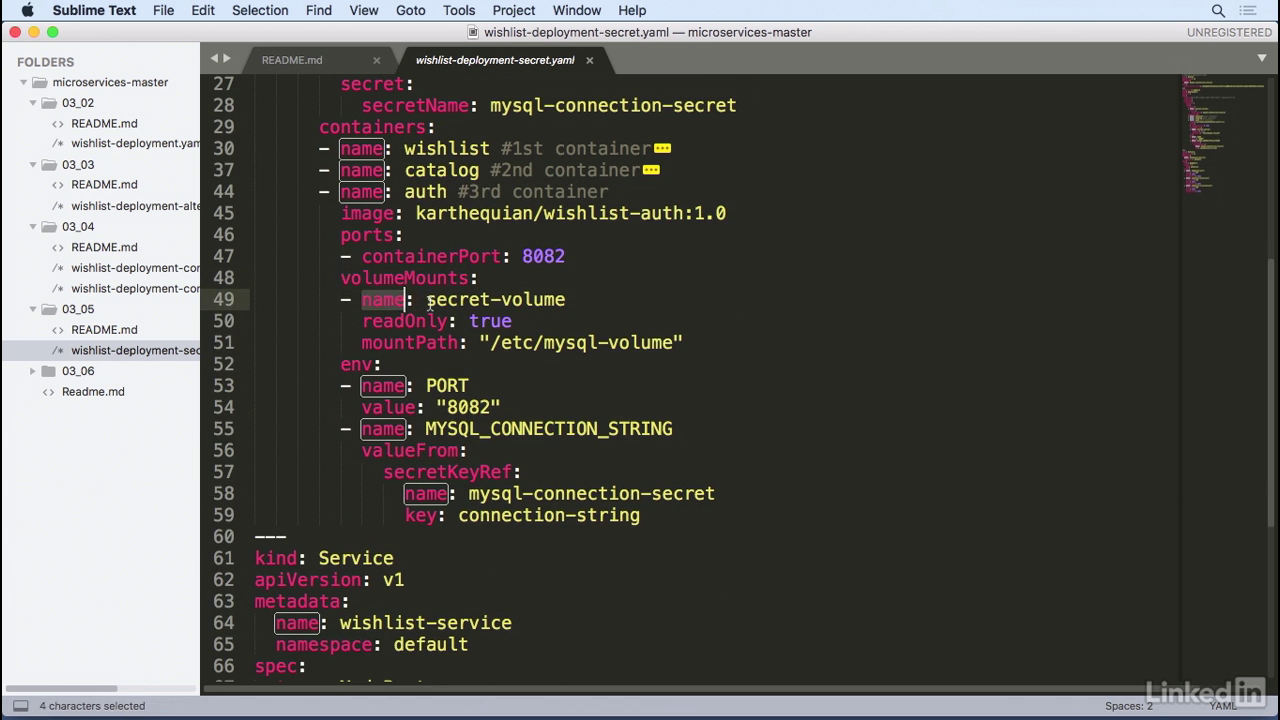
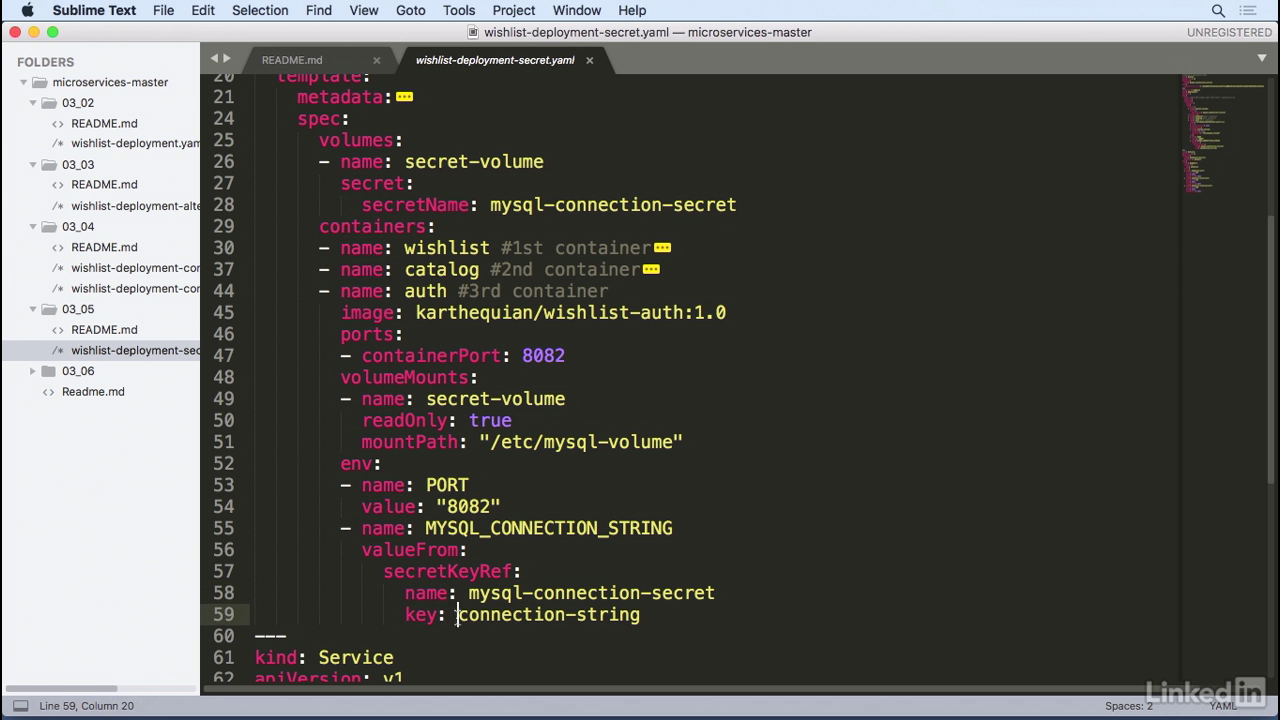
- We can also pass this as an environment variable.
- As mysql connection string, similar to config maps, but instead of configKeyRef we have secretKeyRef with a name and a key.
- And the key over here corresponds to the connection string that we had above.
Running
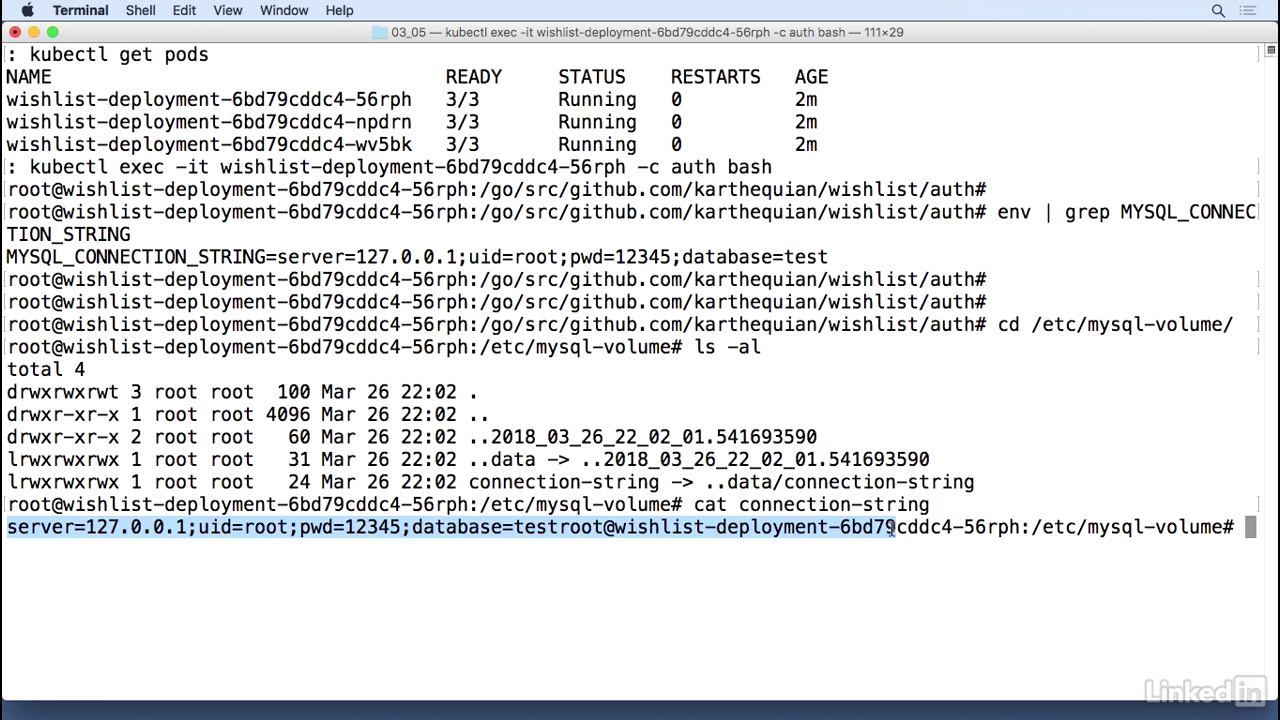
- So now in our running system, let's take a look at this in the pod.
- Let's pick one of those pods. I'm just going to arbitrarily pick the first one.
- Kubect exec minus it.
- And I know this was in the auth container. And bash.
- So I'm in the auth container, and I can do an env and I can do a grep for mysql connection string.
- This gives us back a value, mysql connection string, with the actual connection string.
- Great! That's working as expected.
- And now if we want to take a look at the volume mount, we can go to cd /etc/mysql-volume.
- We do an ls -al here, we'll notice that we have a connection string as well.
- If we cut that out, once again, it's the same value that we had seen before.
- Whoop, there.
- So there you have it.
- You have two ways to get secrets into your container.
- Either by an environment variable or via volume mapping file.
Lecture 016 - Adding liveness probes
Problem
- One of the issues we run into when we have multiple pods inside of a deployment is pod start up times.
- Occasionally, one container in a pod might depend on another container at start up time.
- So if the container number two takes a long time to start up, container number one is not going to be able to perform any actions.
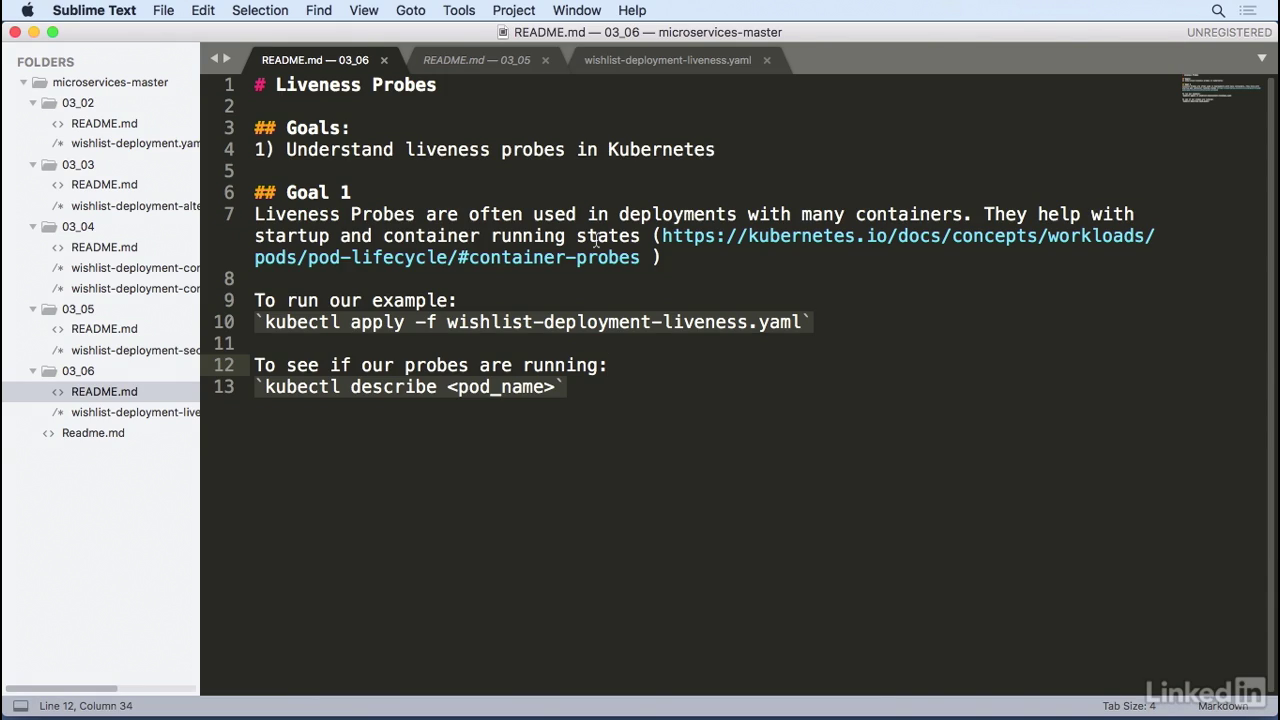
- In the Kubernetes world, one of the ways to kind of get around this is to use a liveness probe, and liveness probes are often used in deployments when there are many containers running for a single deployment.
- They help with start up and container running states.
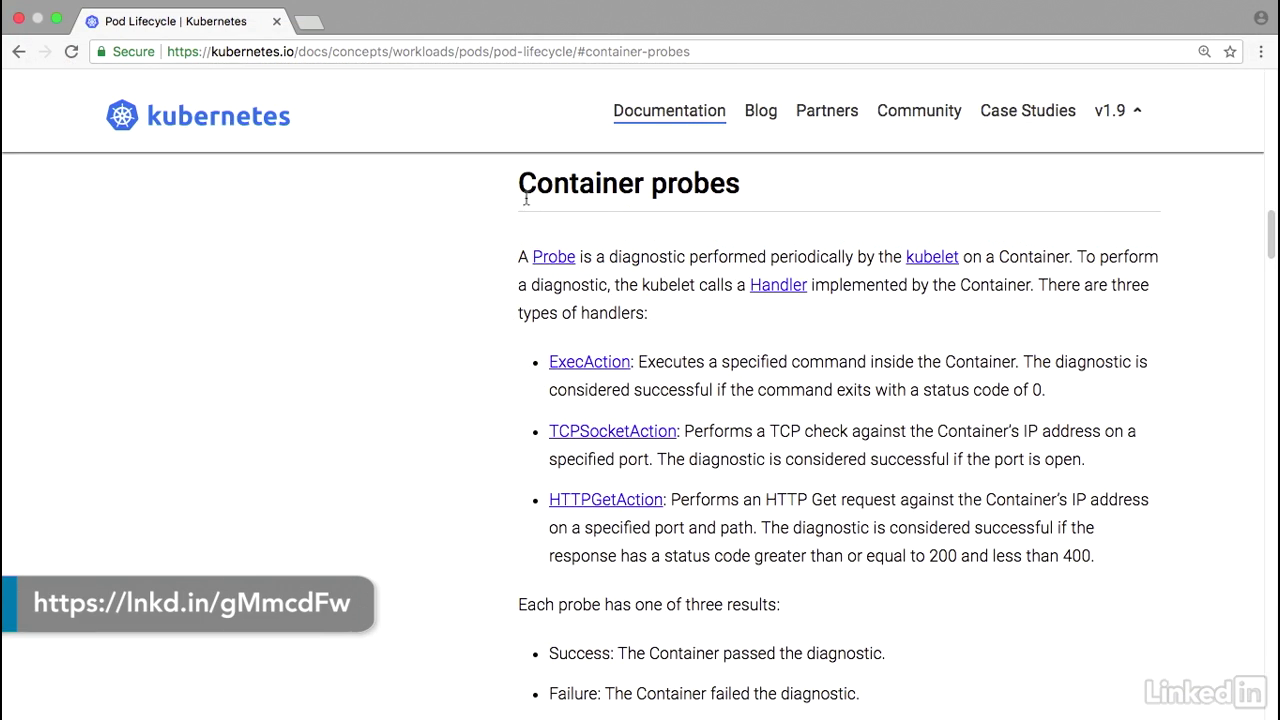
The doc
- Let's take a look at the documentation real quick.
- This is a Kubernetes doc, container probes, and there's two kinds of probes you can use.
- There's a liveness probe and there's a readiness probe.
- The liveness probe indicates when the container's actually running.
- So if for some reason your liveness probe fails, then kubenet will try and restart the container.
- For the readiness probe it essentially tells when the container is ready to receive requests.
- In scenarios where, let's say, you're trying to bring up a big oracle database, or something large that has a long start up time, you might want to use a readiness probe to know when this is up and running.
Example
- Let's take a look at an example of how this works.
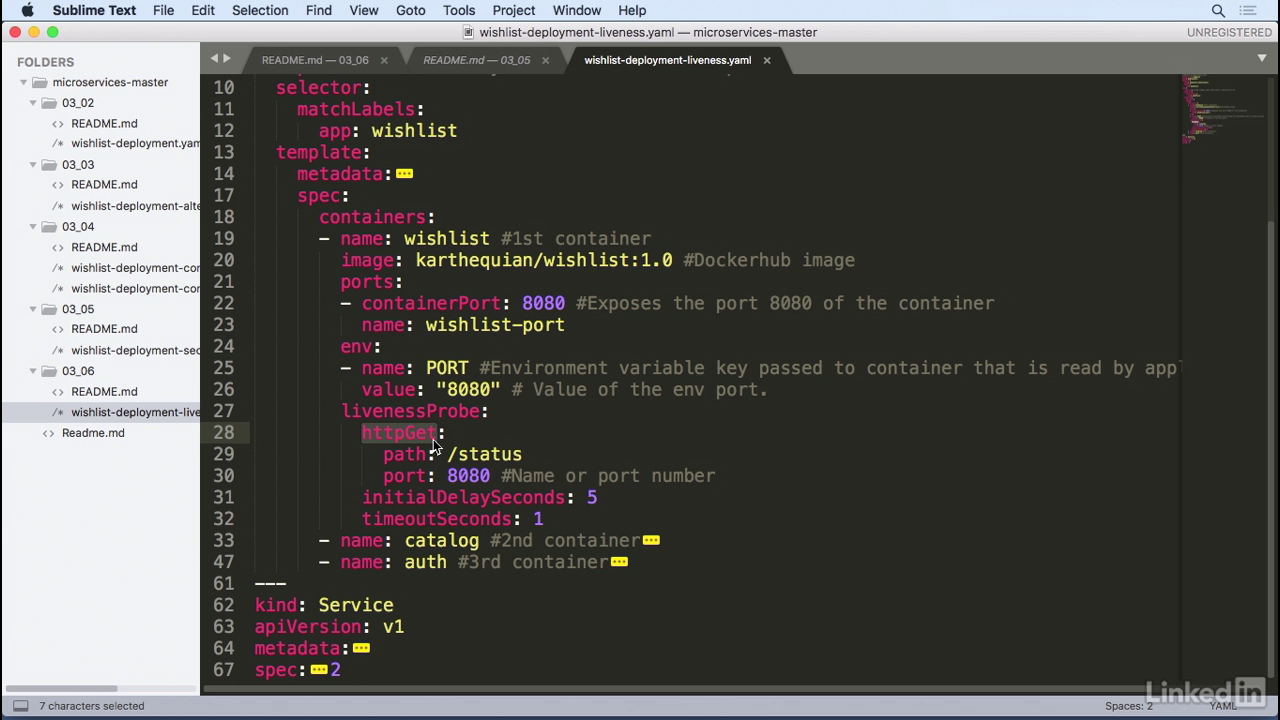
- We have this example where we have wishlist deployment liveness and in the deployment yaml for one of the containers we have a section, after the environment section, called livenessProbe.
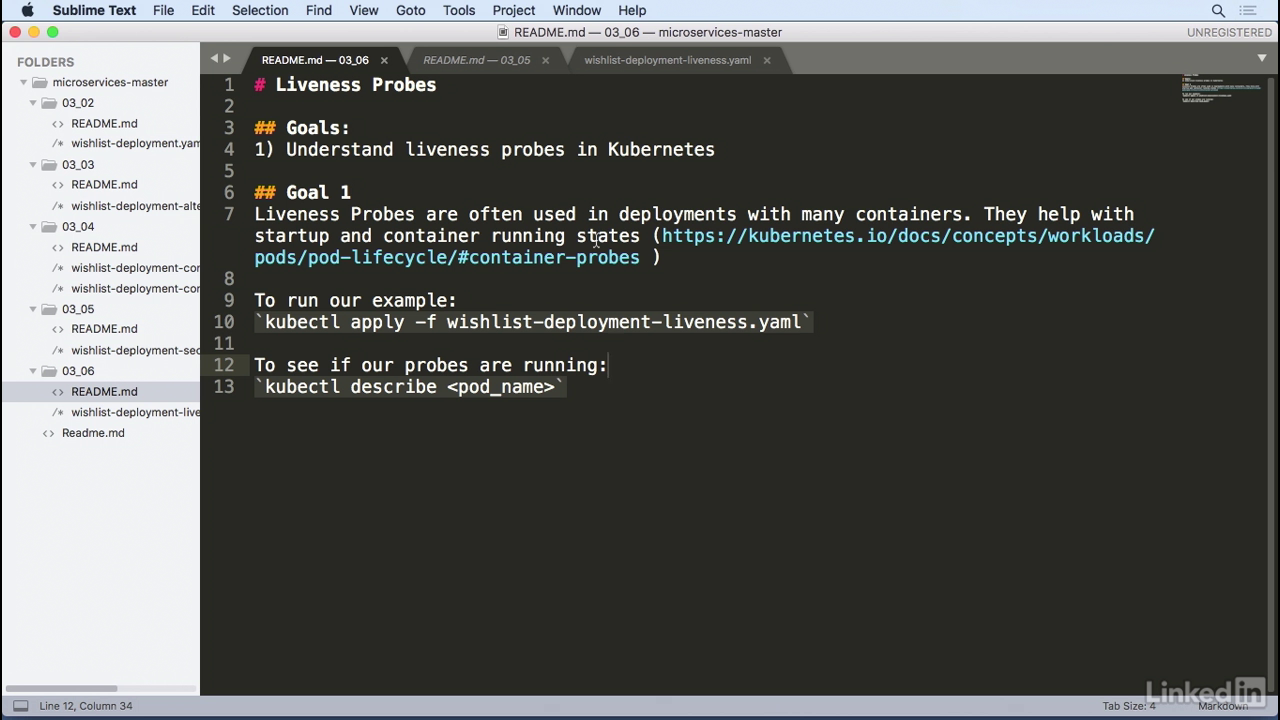
Probe
- So, we're going to configure a liveness probe for the wishlist container, and in this case we're going to use httpGet as the probe where we'll look at paths of status and port 8080.
- This can either be a number or you can use the port name, if you can find a port name for you at ENB.
- I want to configure the initial delay seconds to five, so I'm going to wait five seconds before I start probing.
- And then the timeout, I'm going to set to one.
- I'm going to do this for all of the containers, but the configuration for all of these is pretty much the same.
Run it
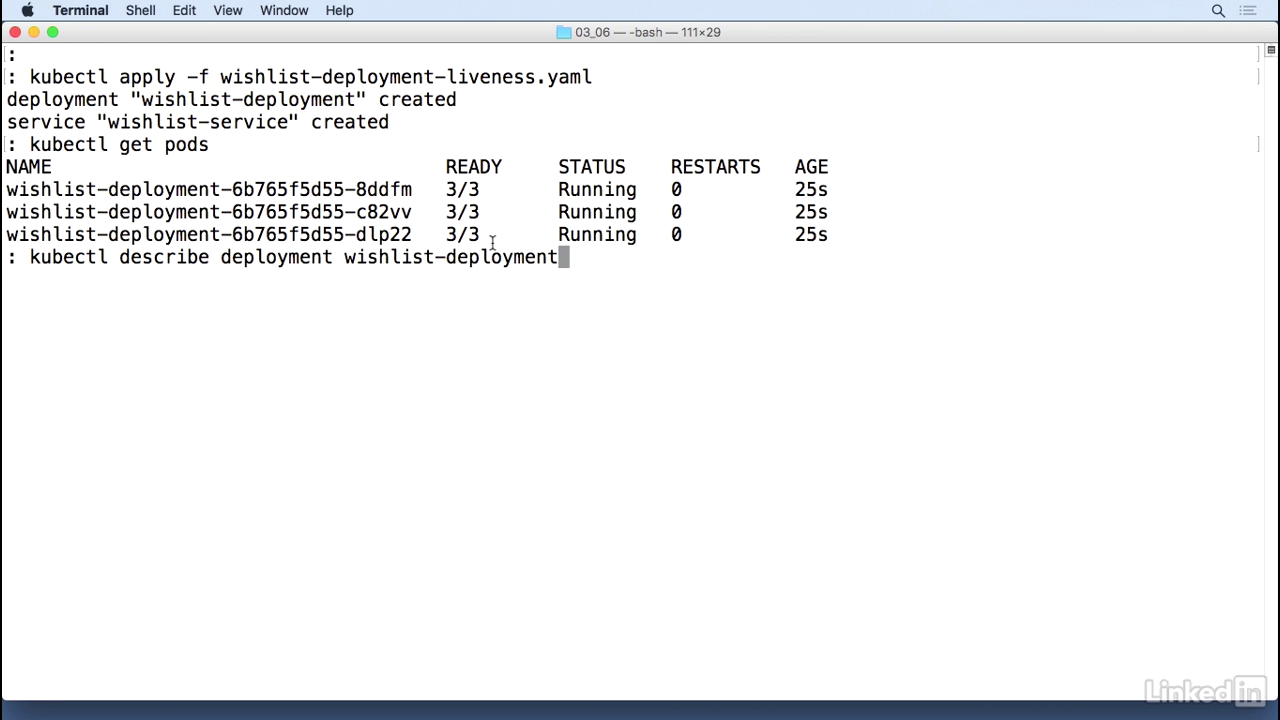
- Kubectl apply minus f.
- You'll notice that the deployment was created and the service was created.
- So, if you do a kubectl get pods, everything looks online.
- And if I do a kubectl describe deployment wishlist-deployment
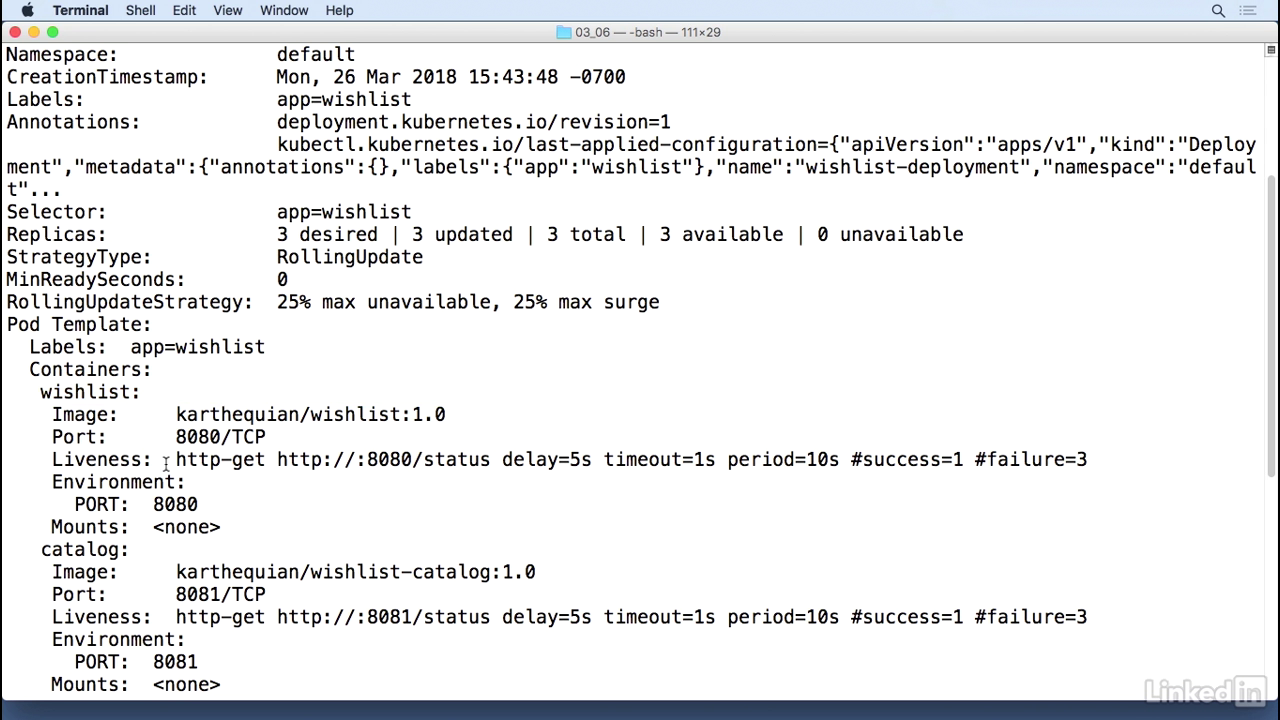
Delay status
- Everything looks okay but if scroll to the top of this you'll notice that there is a section in here for the container, for wishlist, there's a probe associated with it which is doing a http-get for http on port 8080 of status with delay, timeout and period.
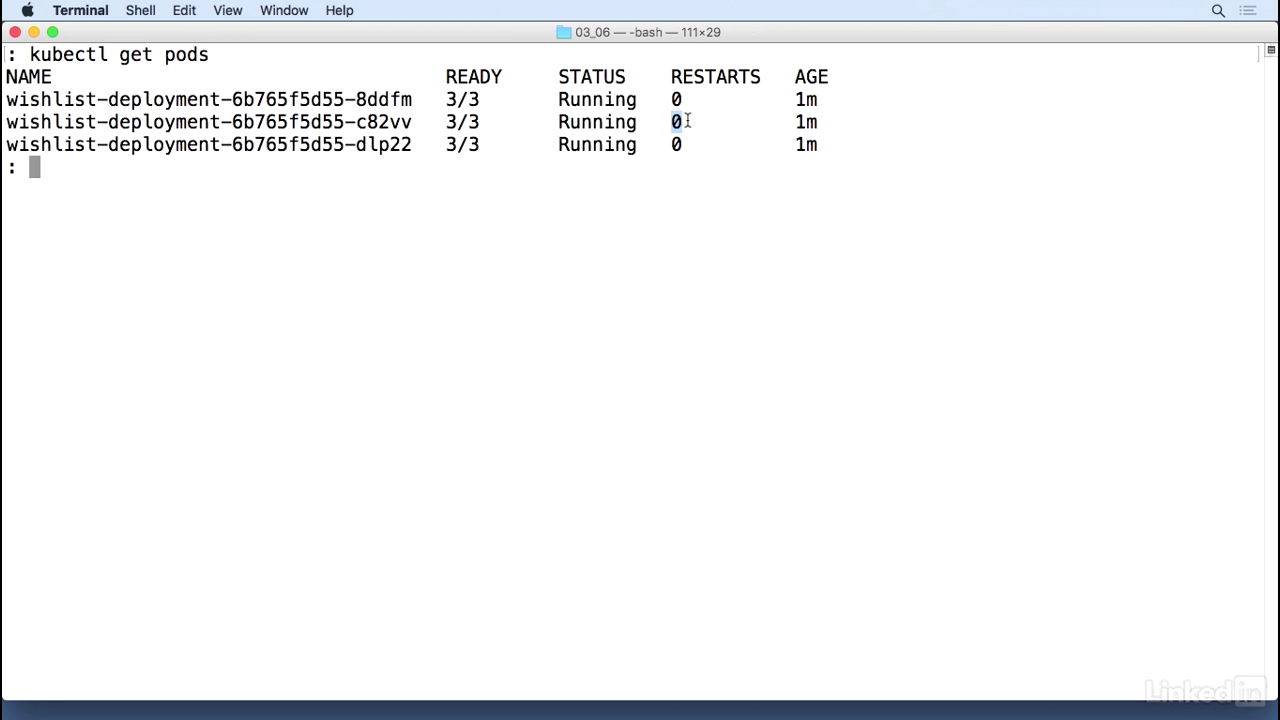
Get pods
- This helps us a lot in scenarios where you might have two containers that come up and when you do a kubectl get pods, if you have multiple restarts for one or more of the pods, it helps you debug what's actually going on behind the scenes, and it helps you start up in a cleaner manner.
Chapter 05 - Advanced Topics
Lecture 017 - Deployment with Helm
About helm
- Helm is a package manager for Kubernetes.
- Kubernetes is all about YAML files, and after a while, when your YAML files grow large, it becomes incredibly painful to debug issues.
- This is why people use Helm to manage the complexity of their YAMLs.
- It also provides a way to easily update and rollback their Kubernetes artifacts.
- And finally, it's also the most popular place to find user-generated charts.
- Think of it like a maven for Java, but for Kubernetes instead.
Chart.yaml
- Let's take a look at how this works for our application.
- In our exercise files, we have a wishlist folder that contains our Helm examples.
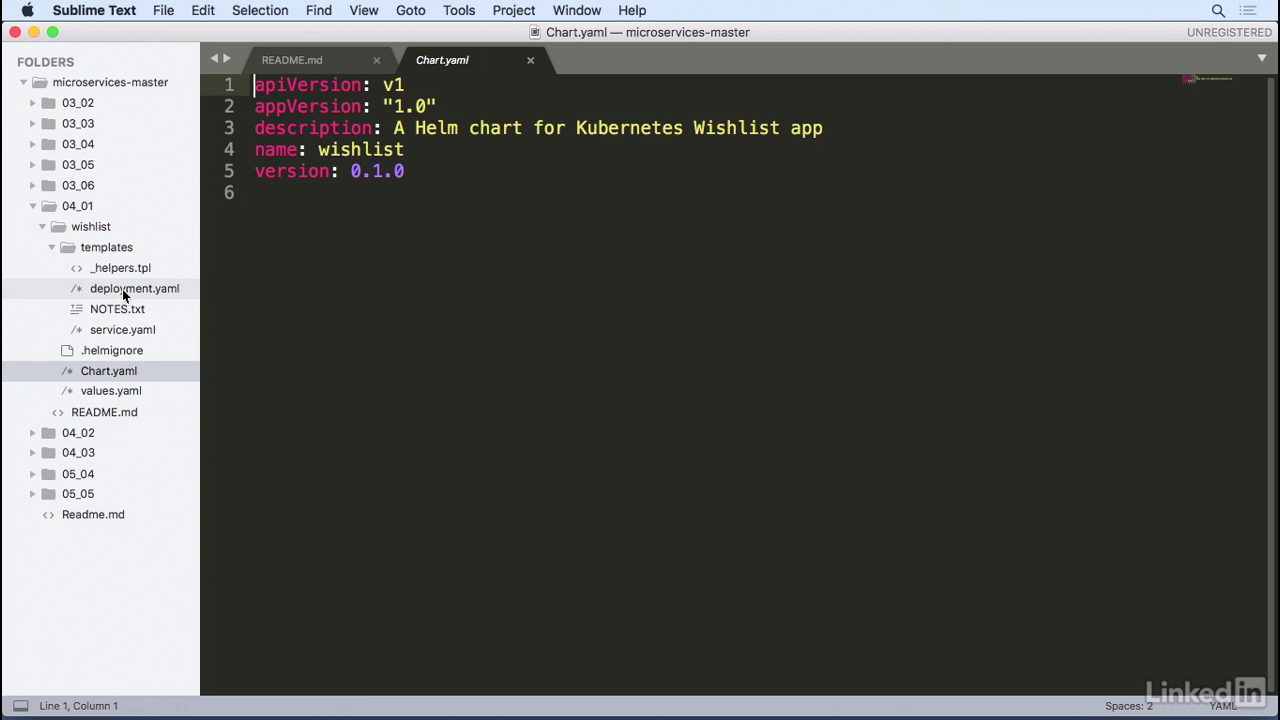
- Let's take a look at Chart.yaml first.
- As we notice, we have some basic information in here including apiVersion, appVersion, a description name, and a different version.
- If you go into our templates, this is where the fun really begins.
- I've broken this template out into a deployment and a service section, just to make it a little bit more cleaner and easier to understand.
Deployment yaml
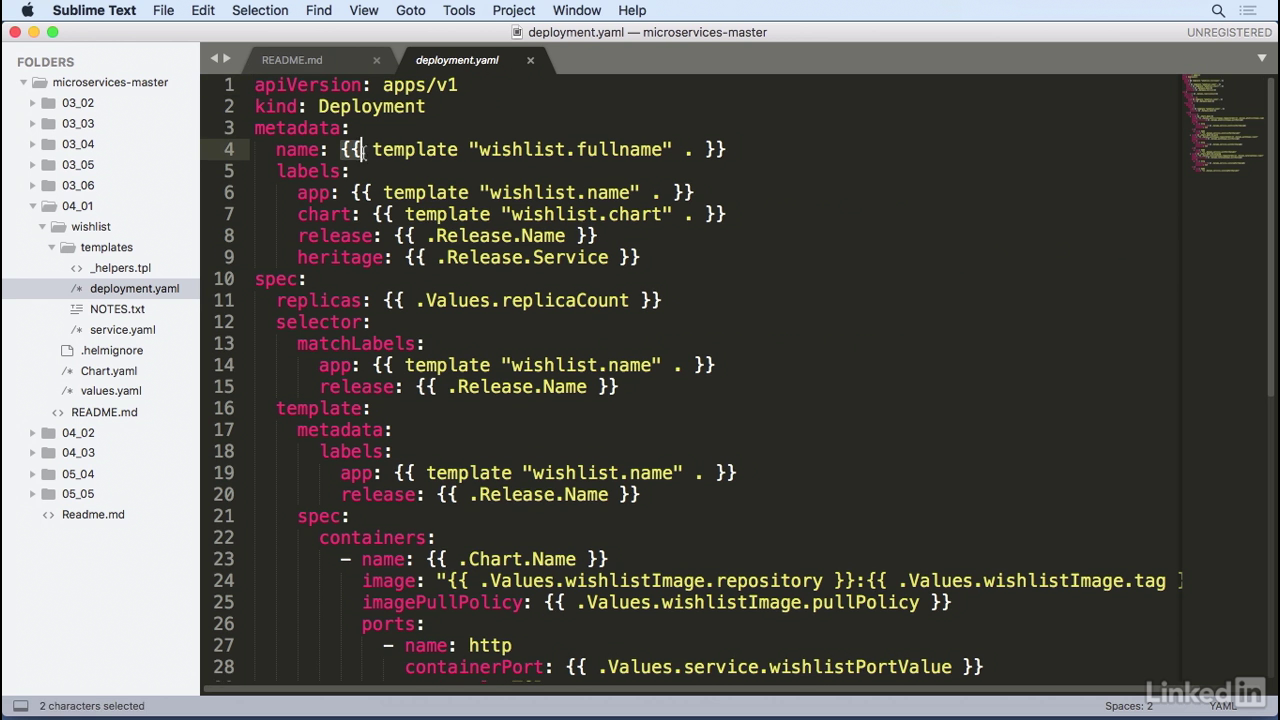
- If you look at the deployment YAML, this deployment YAML looks similar to the YAML that we had before.
- However, there's a lot of curly braces with things like template in it.
- Also, there's a thing called Release.Name and something else called a .Values.something else.
- The templates are actually pieces of code that we can inject into Helm.
Helpers.tpl
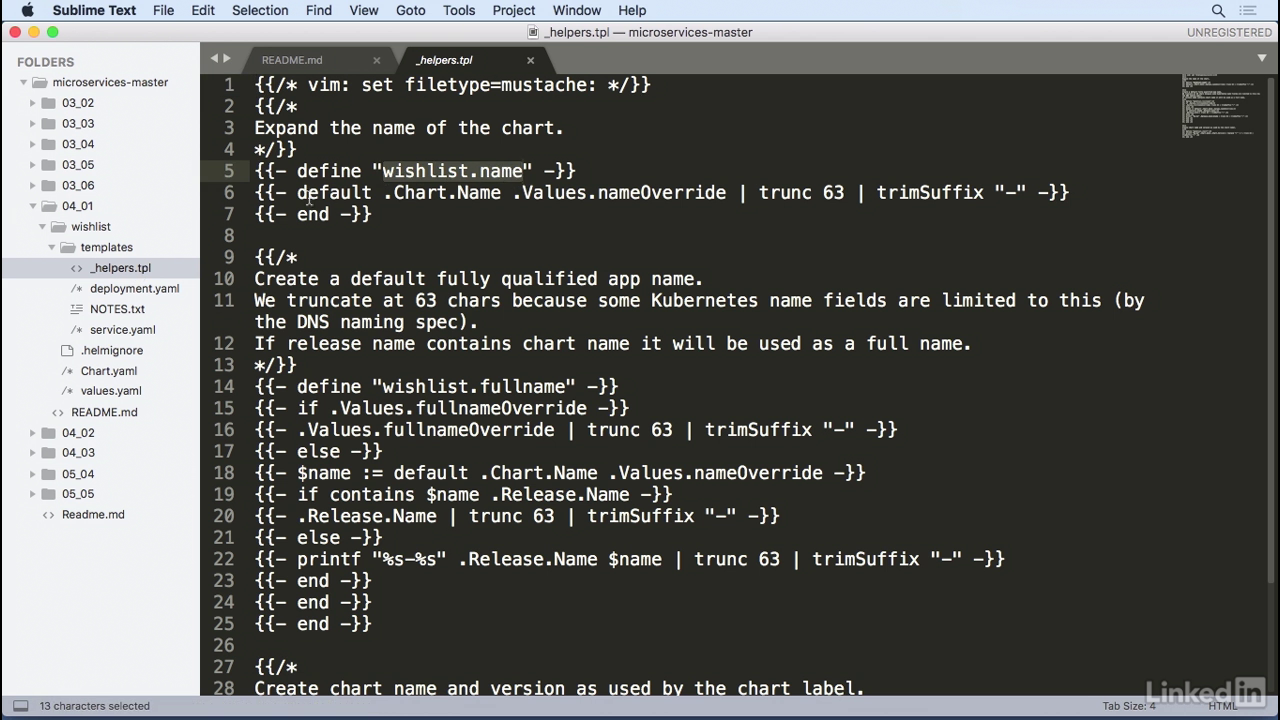
- In this case, I have a helpers.tpl file that defines a wishlist.name.
- And this is an actual definition for a piece of code that I want injected into my deployment YAML.
- Similarly, for releases, the values for this come from the Chart.yaml that we had seen just a little while ago.
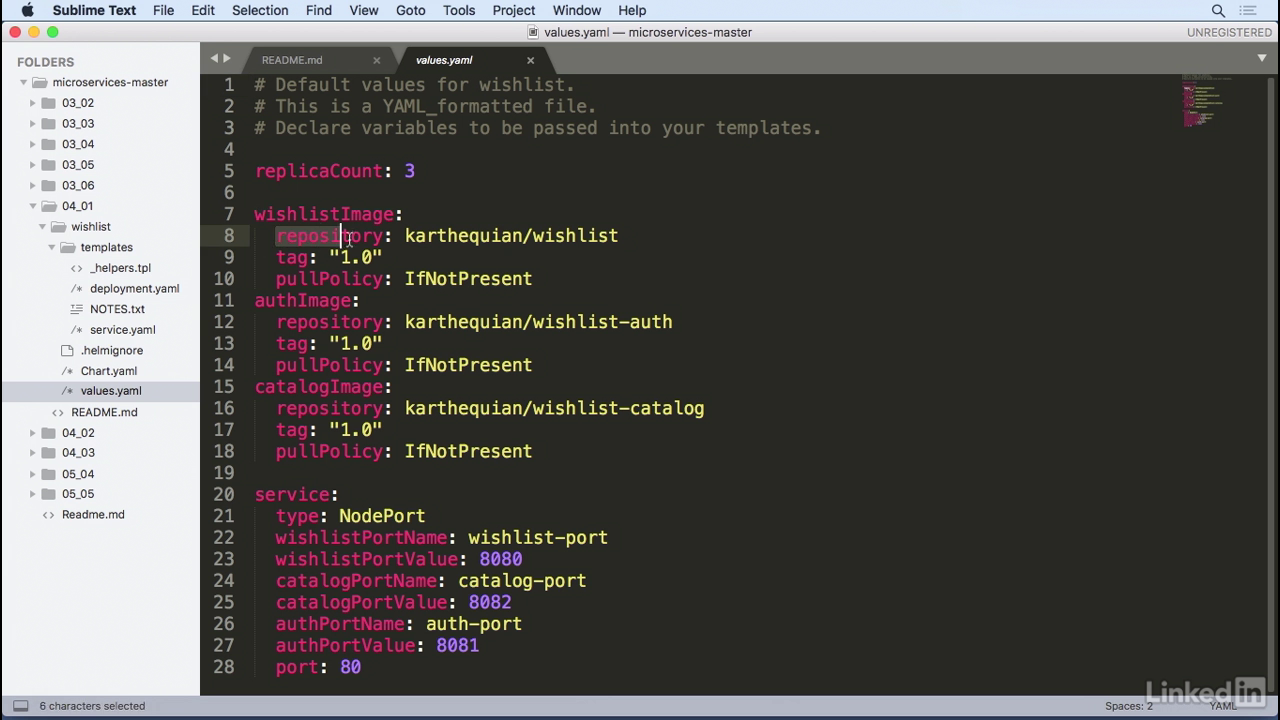
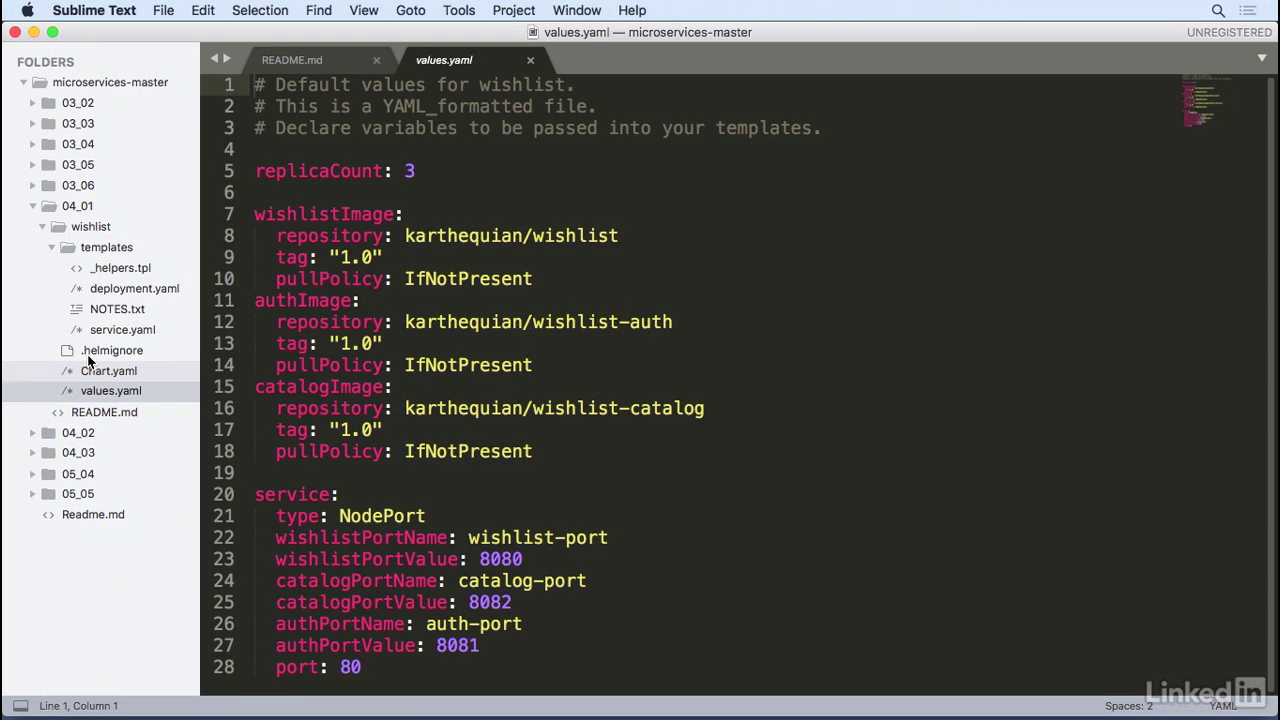
Values.yaml
- And finally, for the values, these come from the values.yaml file.
- If we take a look at that, in here, we notice that these are live values for all of the information that we want.
- For example, it has the repository value for a karthequian/wishlist with a tag of 1.0.
- PullPolicy, we do this for all of the images as well, and service information, too, that ties back to the service.yaml file.
- Once again, the service.yaml file looks similar to before.
- However, we're replacing these values at one time.
Helm version
- I already have Helm installed, and I've installed it using the documentation as prescribed.
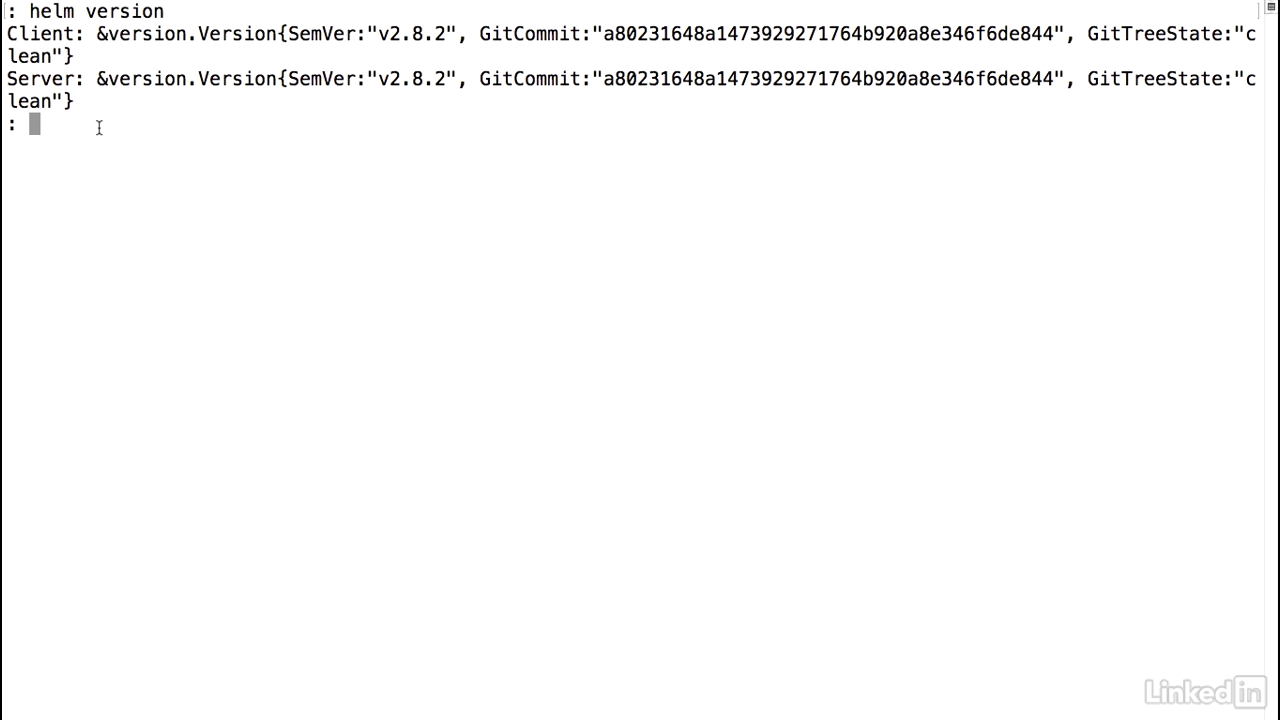
- If I go to my command line, let's do a quick sanity check of our Helm version.
- We notice that we're running version 2.8.2.
- Helm is actually two pieces.
- There's the client piece, which is your Helm command that you're running, and then there's a server, which is the Tiller server that runs as a deployment in your Kubernetes environment.
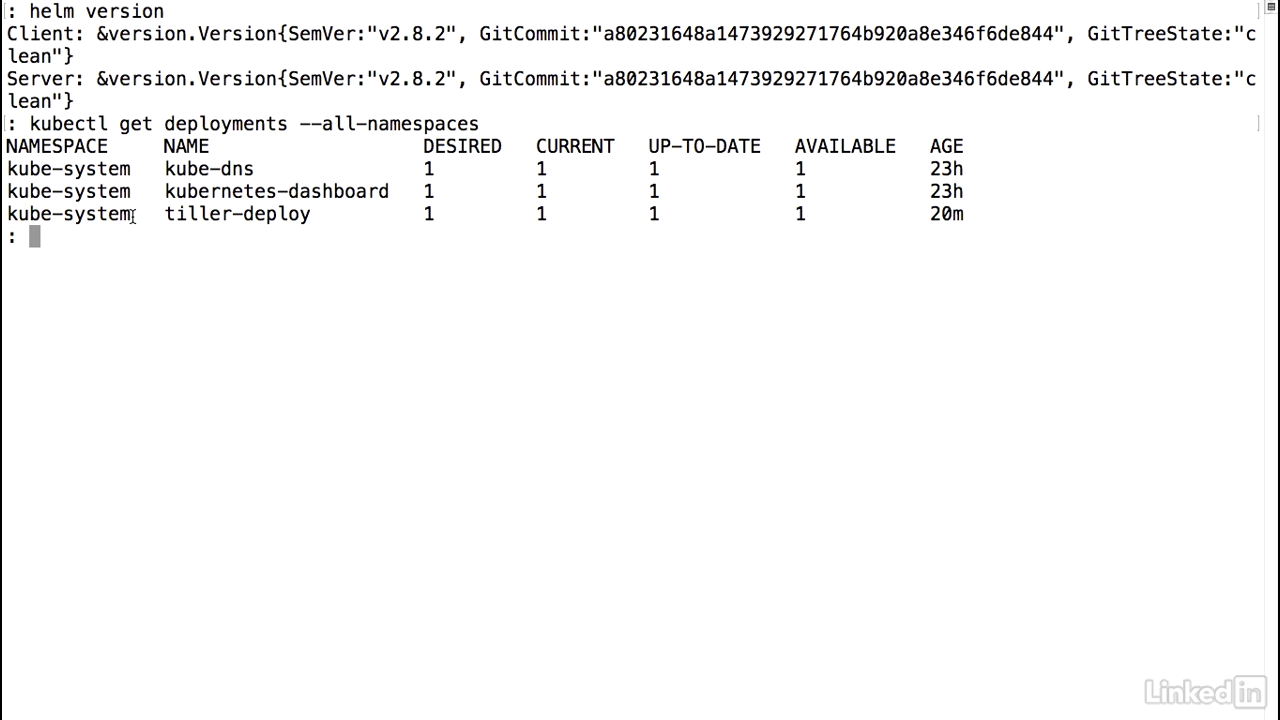
Kubectl get deployments
- So if I do a Kubernetes kubectl get deployments, and if I look at all-namespaces, we'll notice that we have a tiller-deploy that lives in the kube-system namespace.
- This is the server-side component for Helm.
Helm command
- Let's run a helm ls command, and this command will list out all of the charts that we currently have running.
- When we run this, we don't expect to see anything because we haven't done anything yet.
- And sure enough, there's no output.
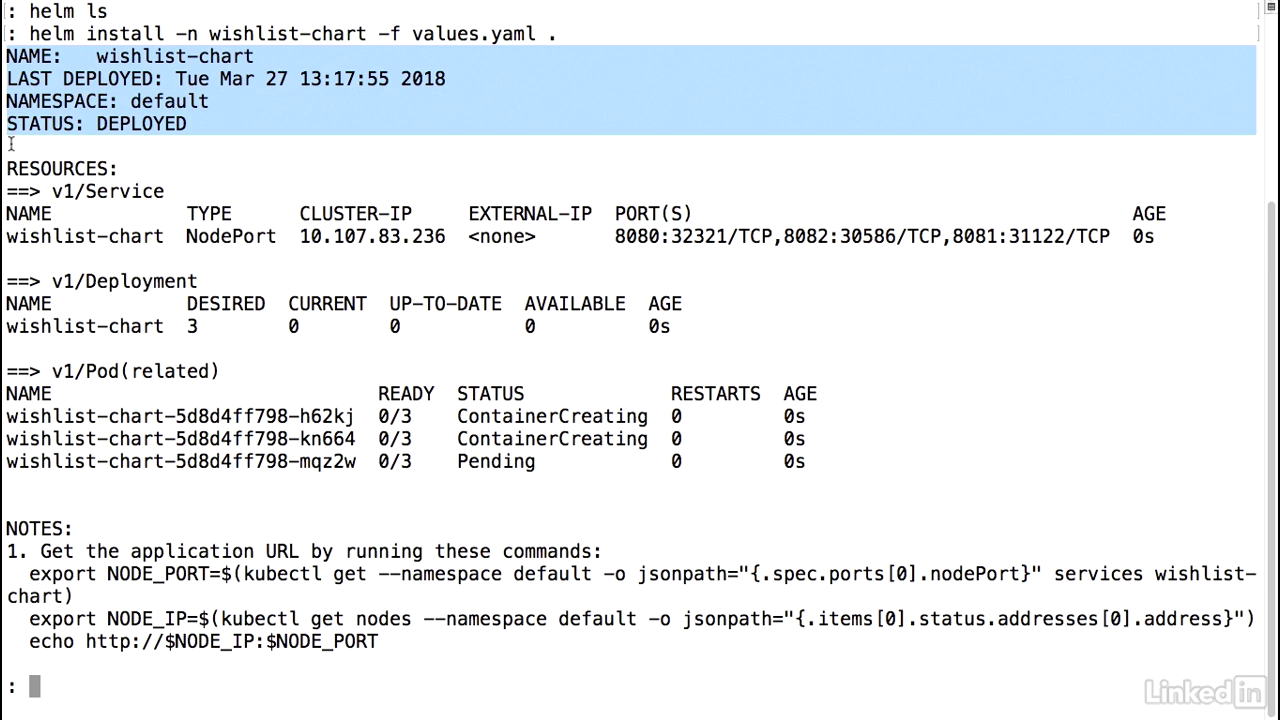
- Let's install our wishlist application that we had talked about earlier.
- To do this, I do a helm install to install a new chart.
- I'm going to call this a specific name, wishlist-chart, and I'm going to pass a value of the values.yaml that I had before, end with a period.
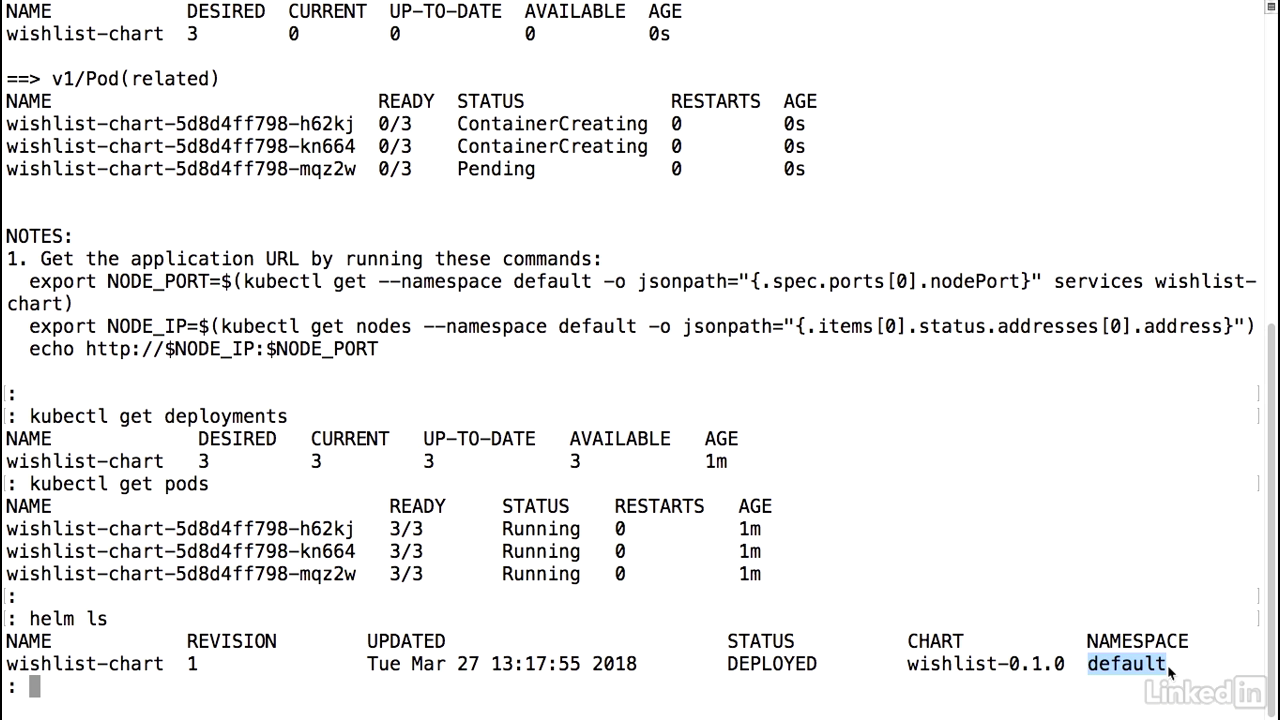
- You'll notice that Helm outputs out some information, the basic information about the chart and when it was deployed, the resources that it includes, including the service, deployment, and the pods that are related to it.
- And you'll notice that some of these are still creating at the moment.
- And finally, there's a NOTES section here, and this is actually populated from the NOTES.txt file that we had created initially.
Note file
- So this information is what gets spit out to you at the end.
Result
- We'll notice that everything is running.
- We can also do a kubectl get pods just to verify the pods are up and running as well.
- Everything looks good.
- And finally, let's do a helm ls again.
- This time, we'll notice that we have a single chart up and running, which is our wishlist-chart, the first revision of it, we did this today, the status is deployed, and the chart name that we had defined, and it's deployed to the default namespace.
- So there you have it.
- This is our application that we've deployed using Helm.
Lecture 018 - Service proxying with Envoy
Section
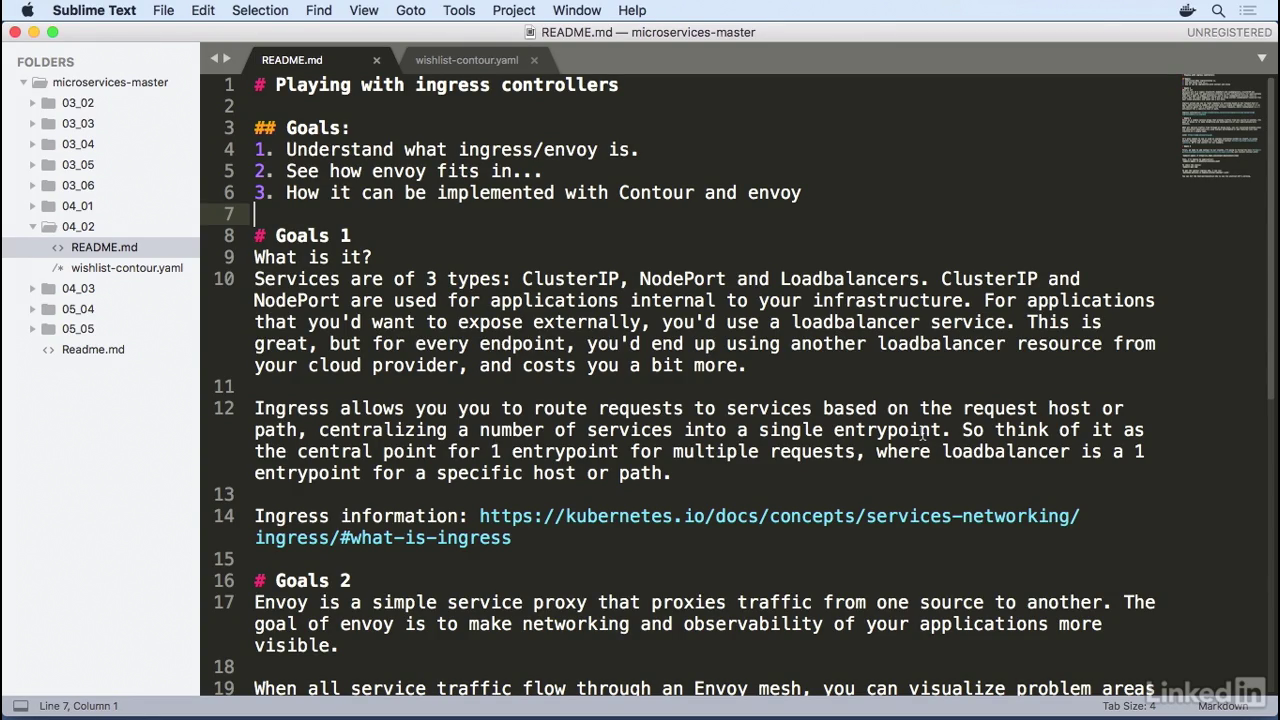
- In this section, we're going to talk all about Ingress controllers, where Envoy fits in, and how we can implement Ingress controllers for our wishlist application.
About service
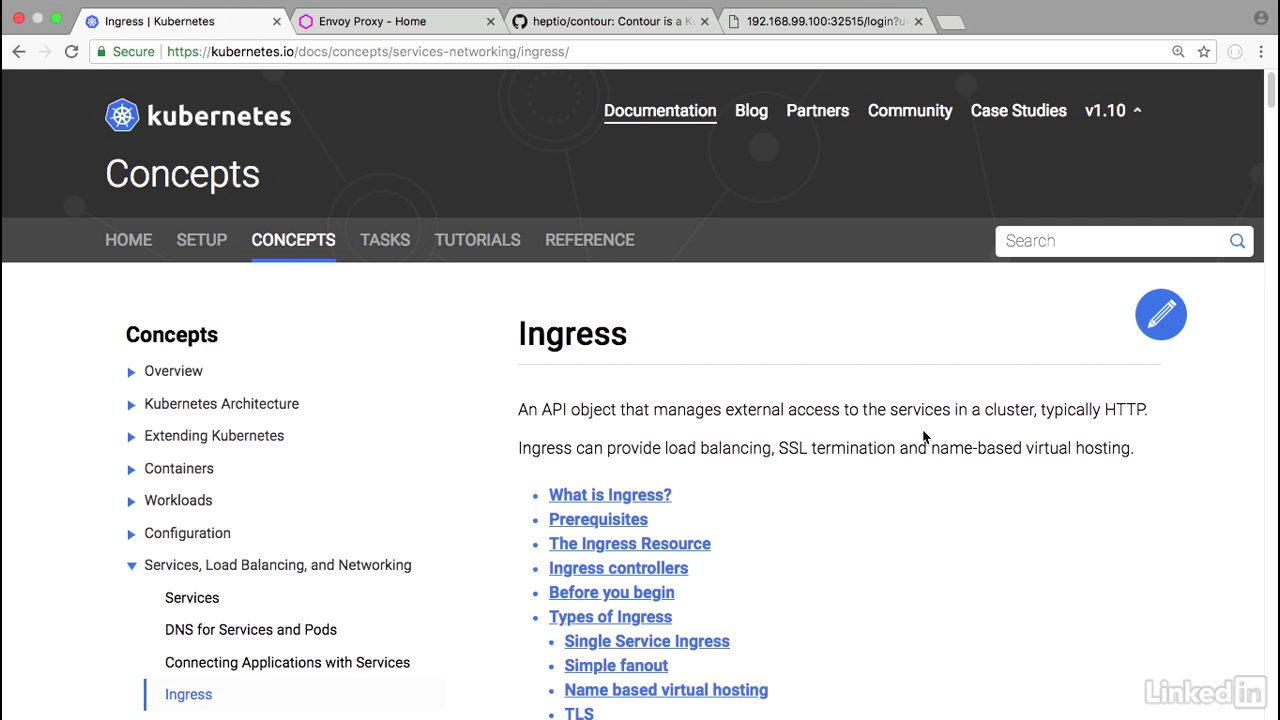
- Services are typically of three types.
- ClusterIP, NodePort, and LoadBalancers.
- ClusterIP and NodePort services are for applications internal to infrastructure.
- For apps that you want to expose externally, you end up using a LoadBalancer service.
- That's great, but for every end point, you end up having to use another LoadBalancer resource from your cloud provider, and that can end up costing a little bit more.
- Ingress allows you to route requests to services based on the request hoster path, centralizing a number of services into one single entry point.
- So think of it as the central point for one entry point for multiple requests, whereas a LoadBalancer is one entry point for a specific host or a path.
About envoy
- Envoy is a simple service proxy that proxies traffic from one source to another.
- The goal of Envoy is to make networking and observability for your application a lot more visible.
- When all service traffic flows through the Envoy mesh, you can visualize problem areas, tune overall performance, and add features like rate limiting in one single spot.
- It's also common to see Envoy used as an Ingress controller either by itself or using something like Heptio Contour.
Contour
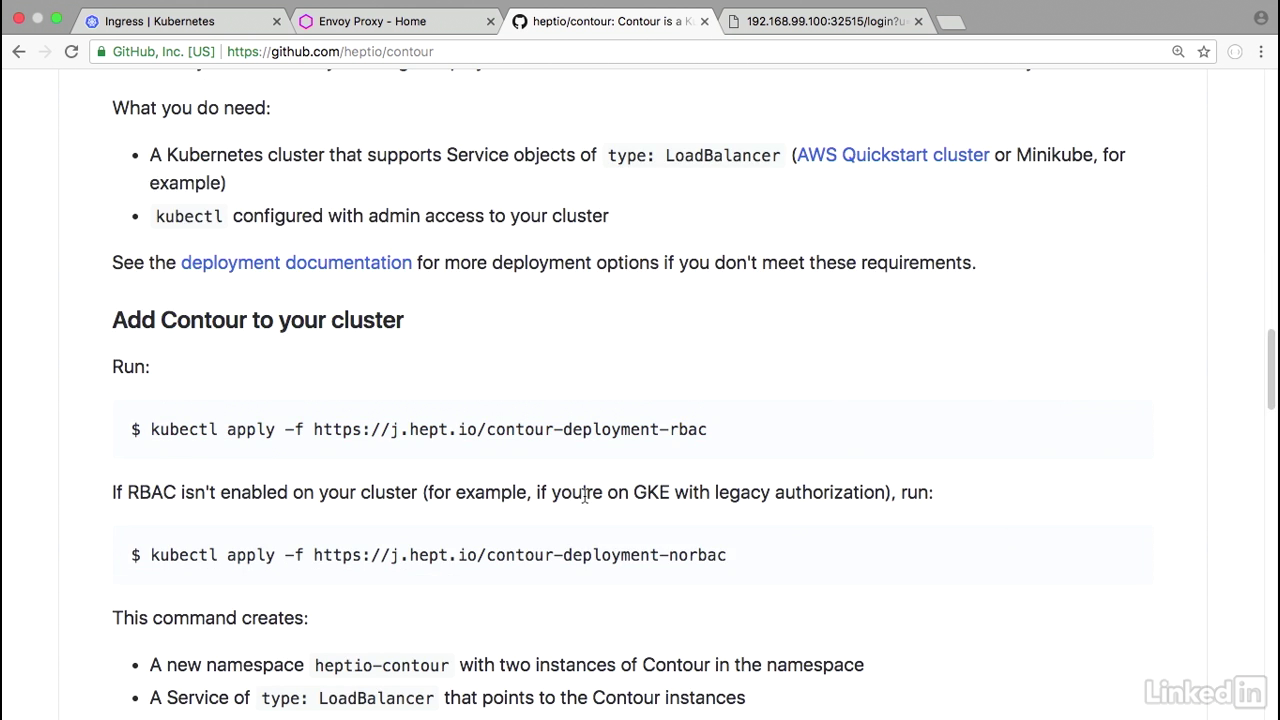
- We'll use Contour as our example.
- First off, we actually need to install Contour and I've already done this using the instructions provided on the GitHub page.
- So before I actually run the commands to run this as a deployment, I'm going to take a look at what we're actually going to do.
Yaml file
- So if we look at our YAML, we'll notice that the deployment section for our application is still the same as before.
- And the service section is similar.
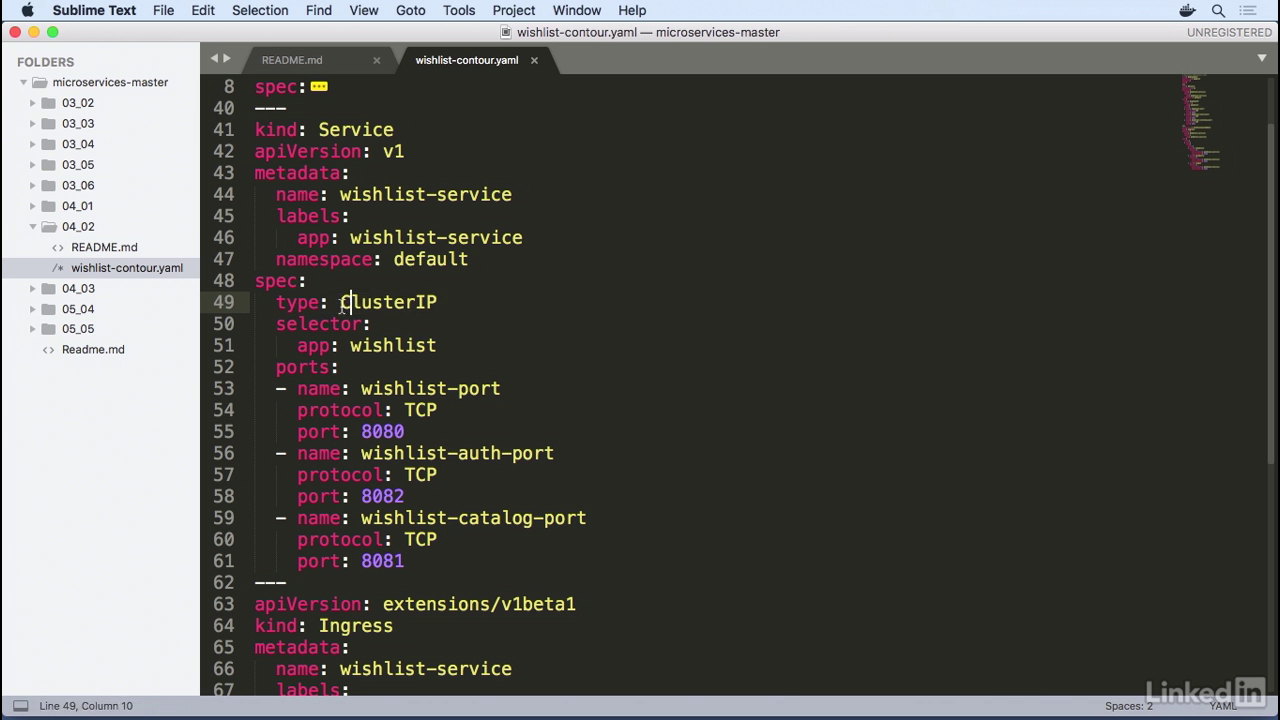
- Take a look at services.
- This looks similar to what we had before, except now instead of type as NodePort, we just have a ClusterIP.
- The data in here still remains similar, but since we're using a ClusterIP, we're not going to be exposing this outside of the application.
Yaml file
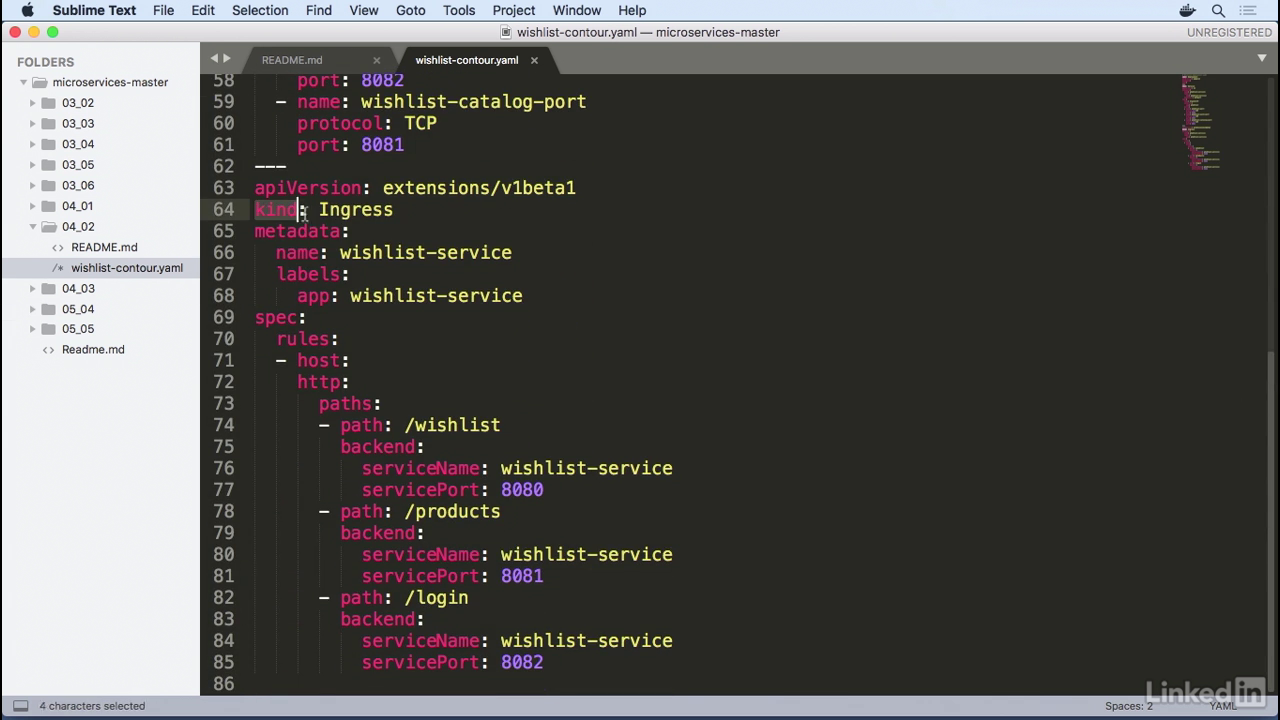
- To do that, we'll end up using an Ingress.
- So this is something we haven't seen before, but it's very similar.
- It's of a kind Ingress.
- It's labeled as wishlist-service, which relates it back to our service from above.
- And in our rules, we have for all hosts.
- We're going to use the HTTP paths for this.
- So for path wishlist, we're going to make this hit the back end of wishlist service on port 8080, which is our wishlist port over here.
- Similarly, 8081 for products, and 8082 for login.
Running
- To run this, I would do a kubectl apply minus F Wishlist-contour.yaml.
- Deployment's been created. Service has been created. And Ingress created as well.
- We know what these would look like, but Ingress is new, so let's take a look at that.
- Kubectl get Ingress, or ING.
- We'll notice that we have a wishlist-service for our Ingress, for all hosts.
- We don't have an address here, but if we were using it with a real LoadBalancer, we would see a LoadBalancer URL.
- Running on port 80.
- Live for 34 seconds.
- Now our service is up and running, let's verify that our pods are okay.
- Get pods. Pods look good.
- And then let's verify that our actual Ingress service is up and running as well.
- To do this, we would do a kubectl get services.
- But we know that this is not running in the default namespace, so let's just look at all of our namespaces.
- We see here in the Heptio Contour namespace, we have a LoadBalancer called Contour running.
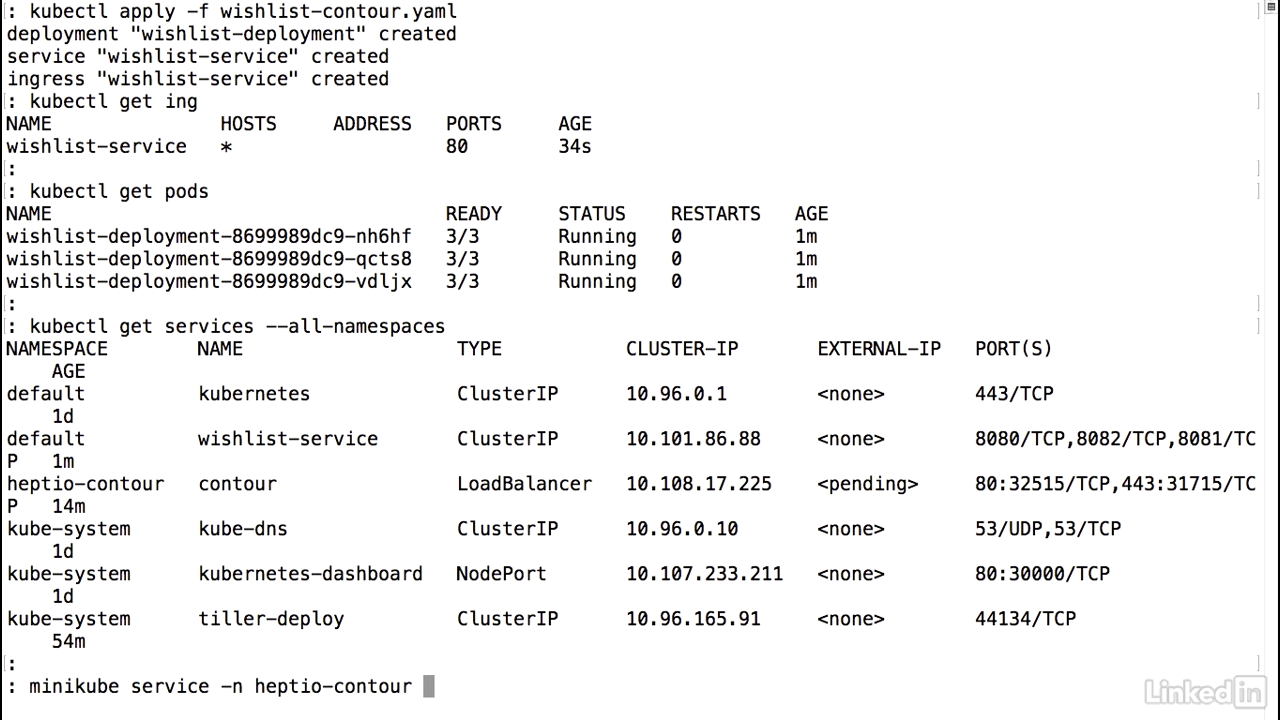
Get the url
- In order to expose this and get the URL, I would do something similar to what I've been doing before using the minikube service command, except I need to specify the namespace.
- So it's minus N Heptio-Contour.
- And then the actual name of the service Contour. And then the URL.
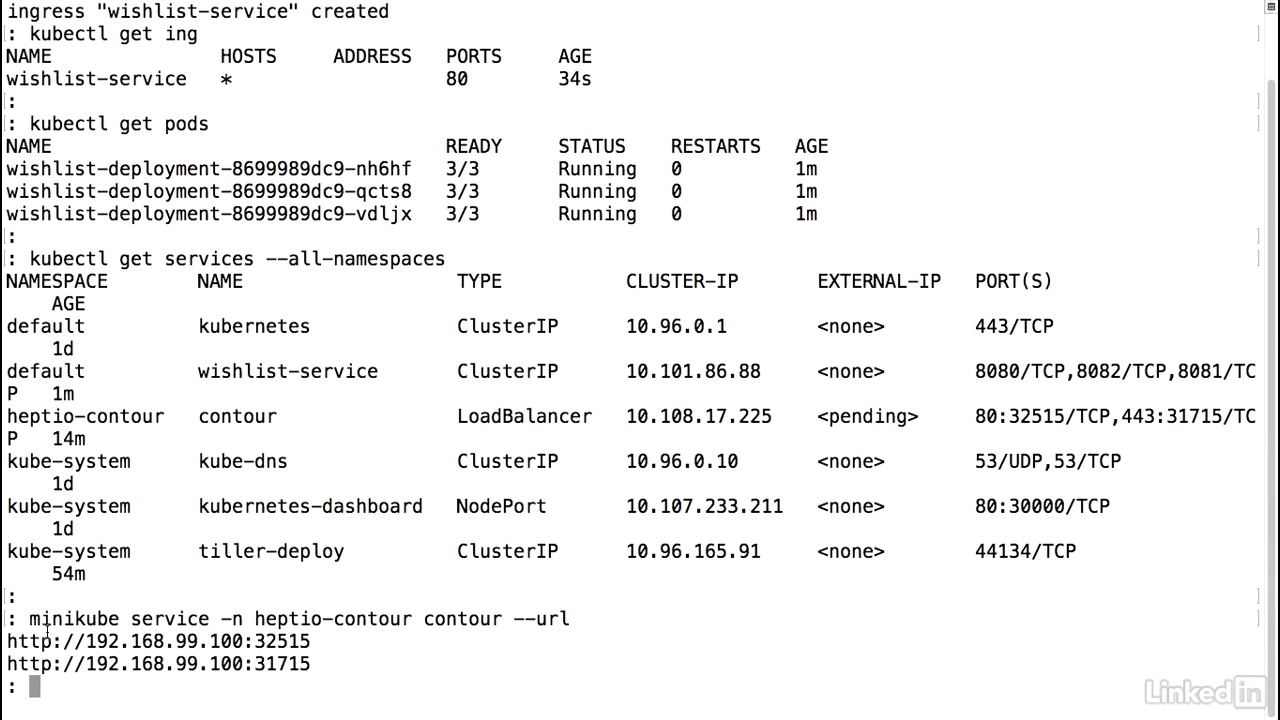
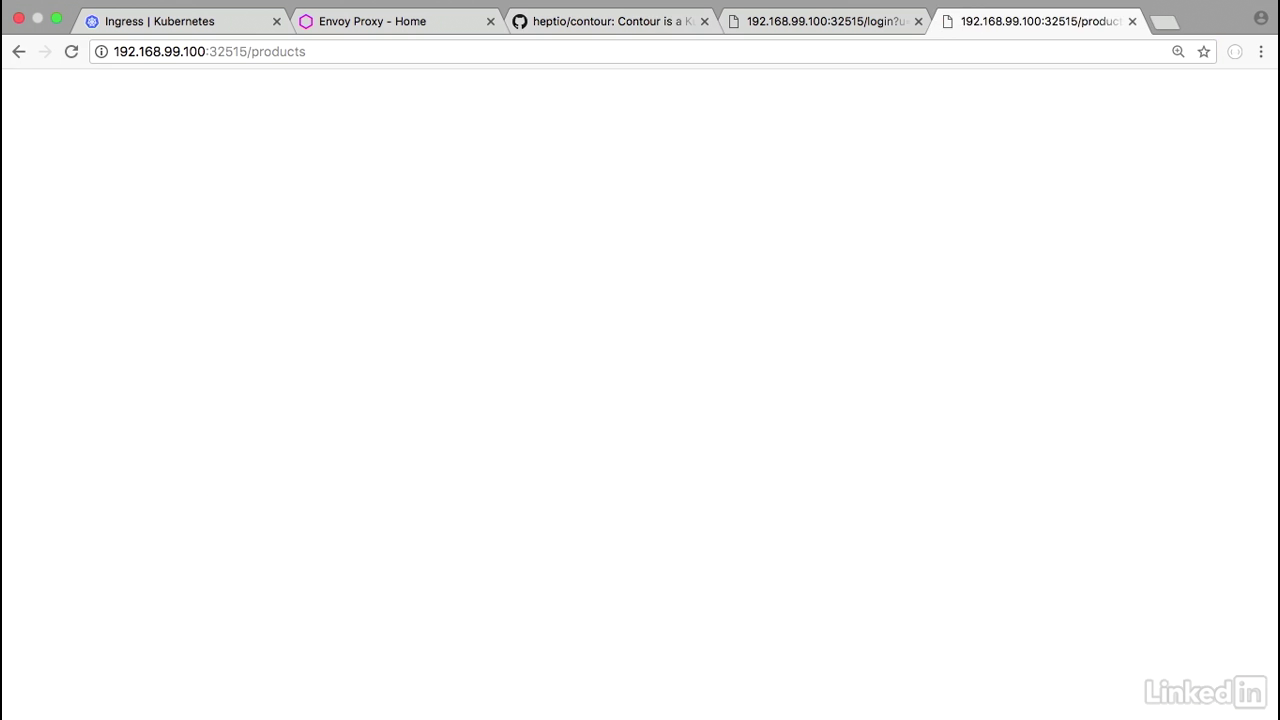
Viewing in browser
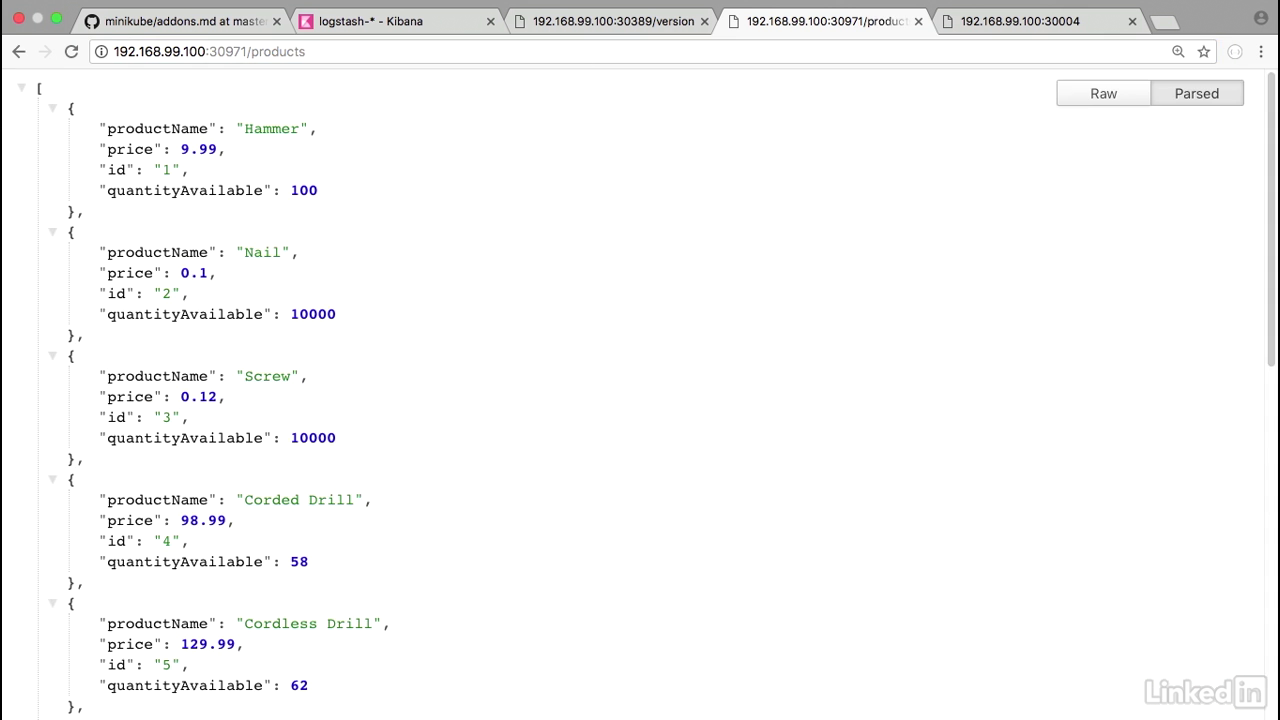
- Going to take this URL, and go back to my web browser, paste this, and I know that products is one of the URLs that I wanted to try and hit.
- So if I go to that, I notice that I have my product information.
Viewing in browser
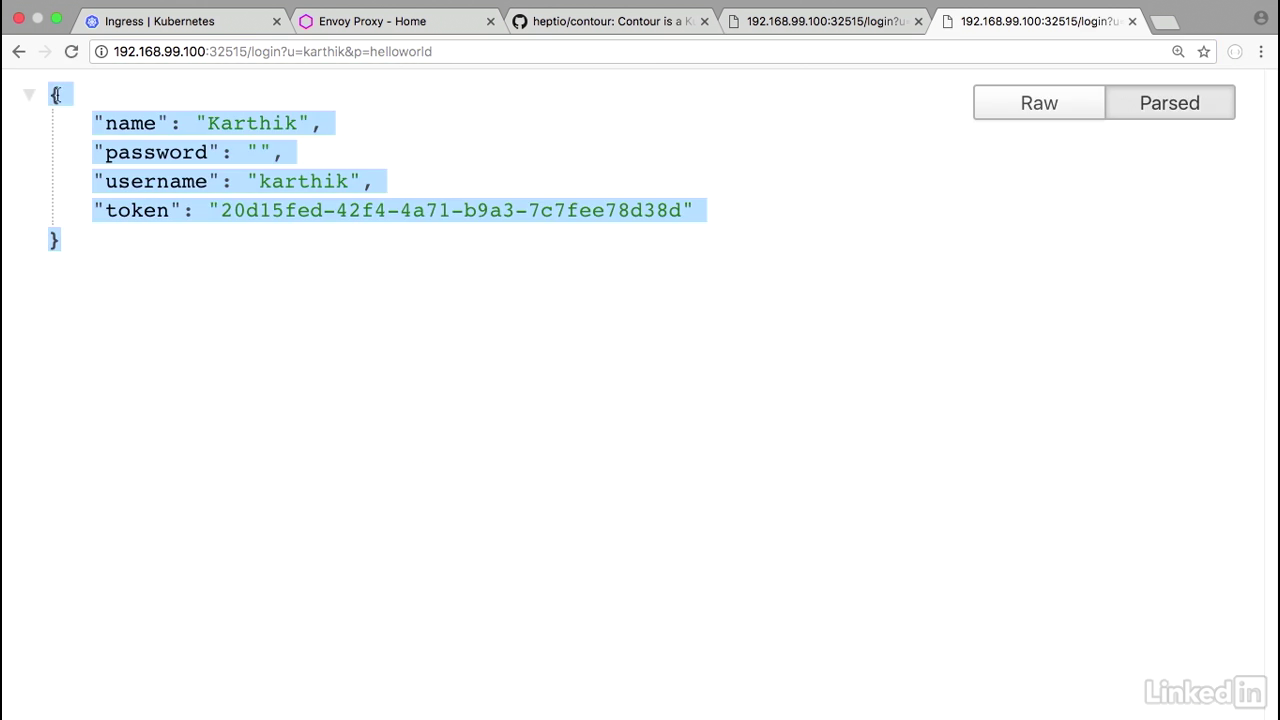
- Similarly, if I wanted to take a look at the login, I have this cached.
- So I can do a login with with the UM password, and I get back information as well.
- So here what's happening is we had one single URL in our application even though it's running as different services, still gets mapped to a single end point, login or products.
- Or...
- So there you have it.
- We have our application running as deployments and services, but it's fronted by an Ingress.
Lecture 019 - Metrics with Prometheus
About prometheus
- So there you have it.
- We have our application running as deployments and services, but it's fronted by an Ingress.
Install
- Go back to my console I can do a helm install stable prometheus, and I'm going to name this prom-demo and I'll pass in a property file to this called values.yaml.
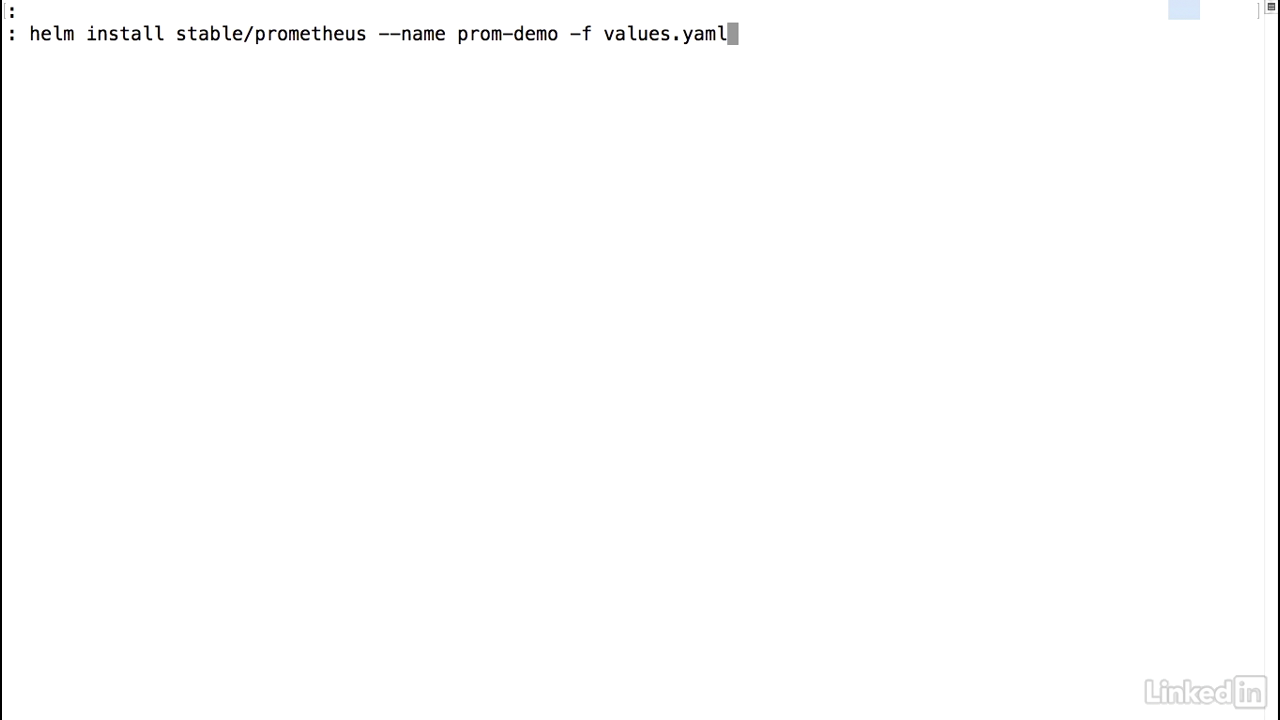
The yaml file
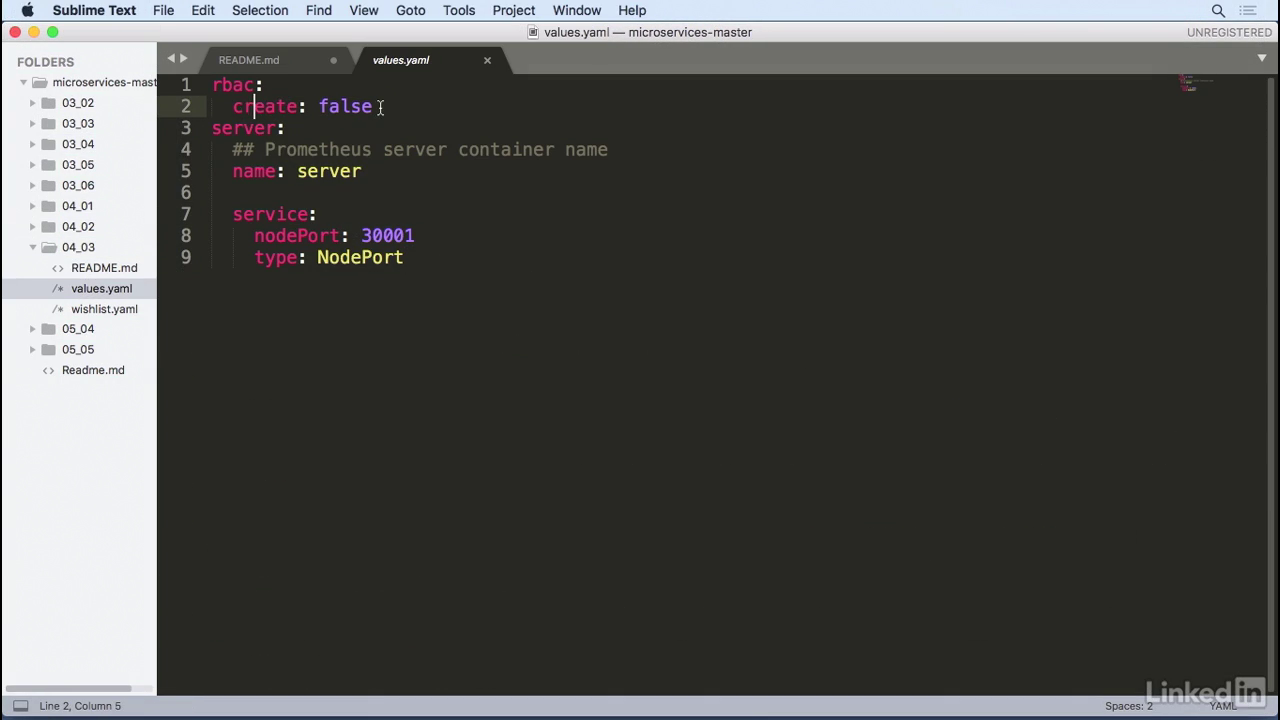
- Let's take a look at the yaml file real quick. Values.yaml.
- It just has some simple overrides in it, namely not use rbac and also on the server side for the service use a node port service and expose it on 30001.
View status
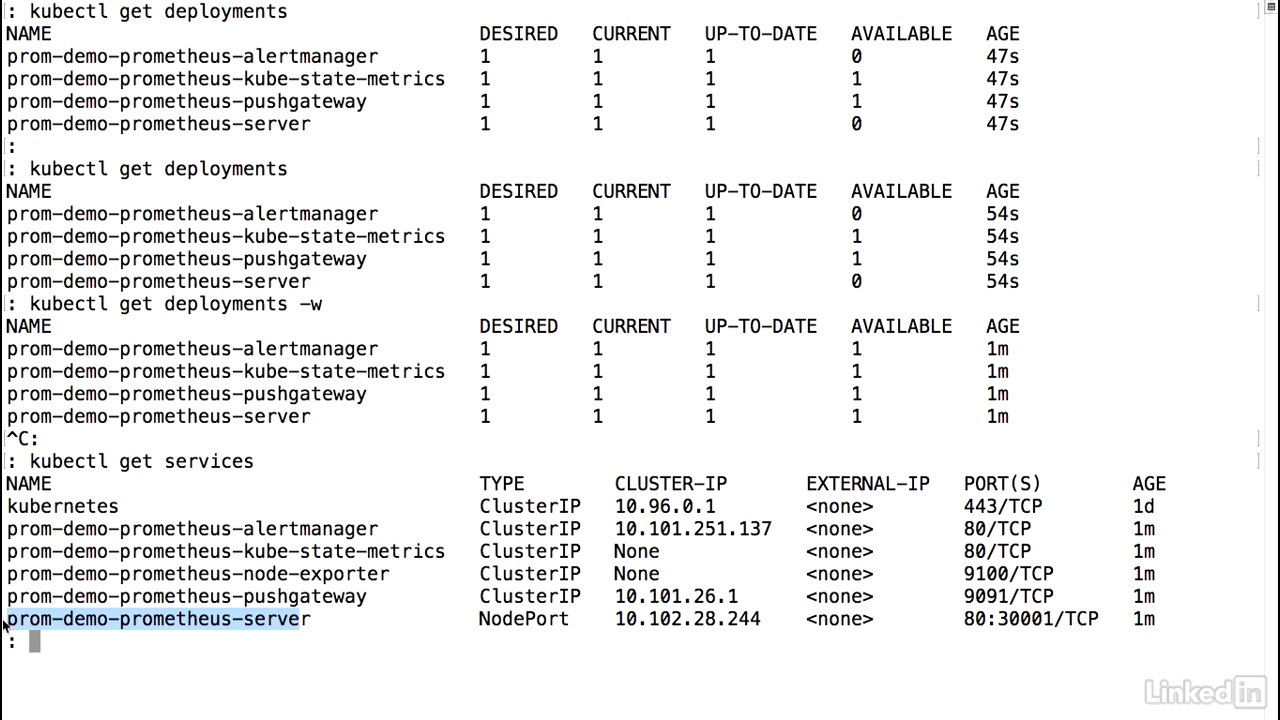
- Do a kubectl get deployments.
- Looks like the server is still coming up, as well as the alert manager.
- I can do a kubectl, get deployments minus watch.
- Ope, looks like everybody's online.
- One available, one available.
- That looks promising.
- Take a look at the services.
- Prometheus server is up as well.
- And then node port.
Viewing in browser
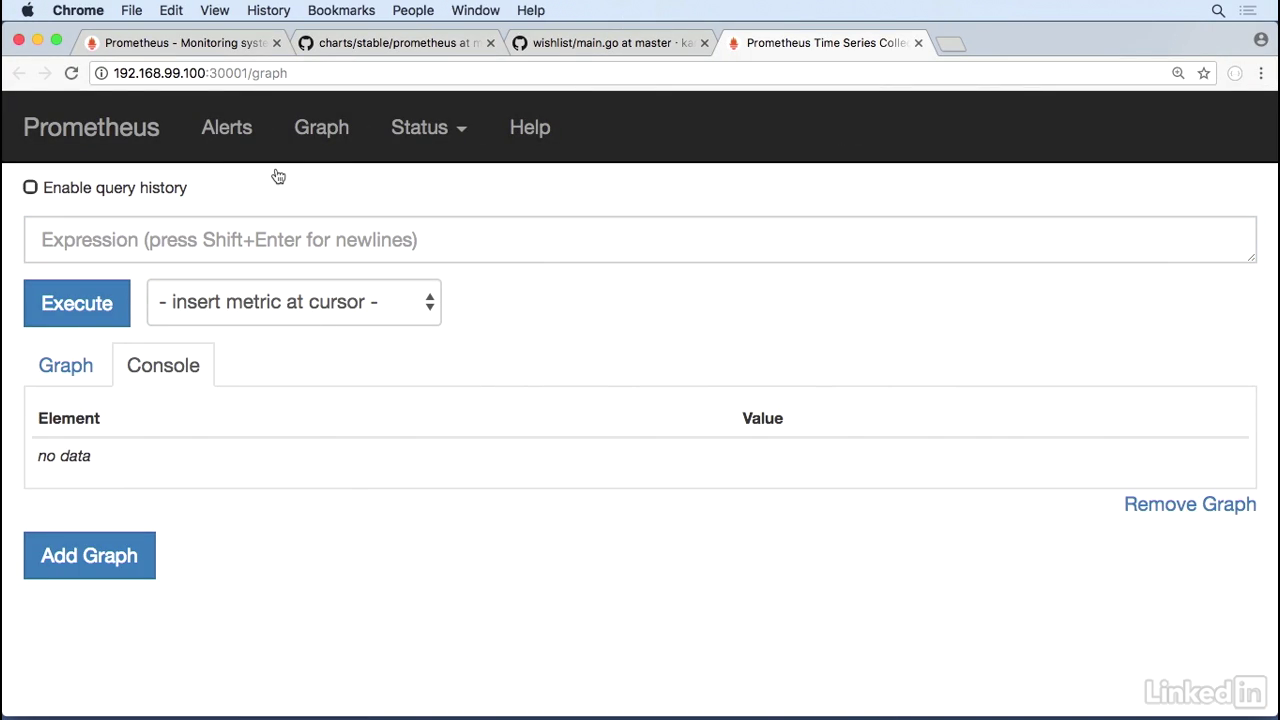
- So let's go ahead and try and hit the UI.
- To do this we would do minikube service, prom-demo prometheus server.
- This brings up the Prometheus interface, and you notice that it has a little expression area where you can execute a graph and a console area as well.
- So Prometheus is typically used for three reasons.
- You can monitor your Kubernetes cluster, you can look at node information, and you can also have app metrics that you can monitor.
Look at Kubernetes statistics
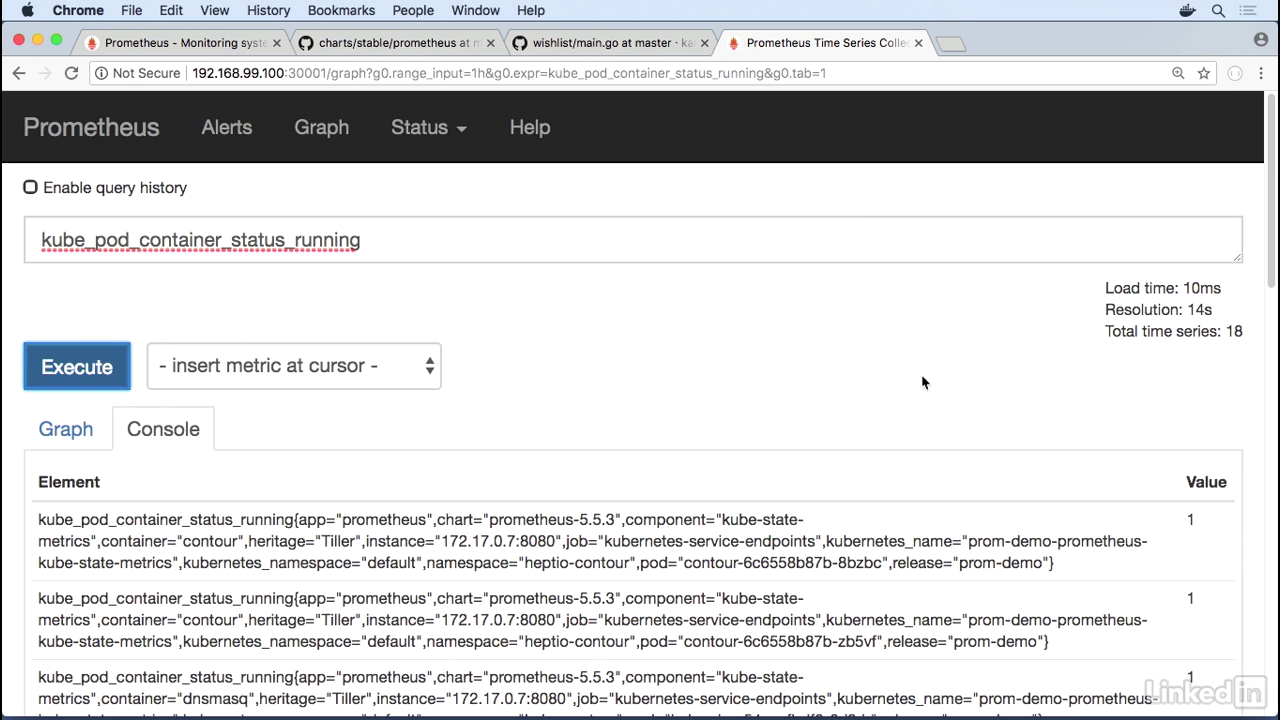
- So if you want to look at Kubernetes statistics, we've already instrumented Prometheus to do this.
- So if I type in kube let's take a look at pod containers, pod container, status.
- Let's look at the running containers real quick.
- This gives us a little list of all the containers that we have running.
- Looks great.
Count
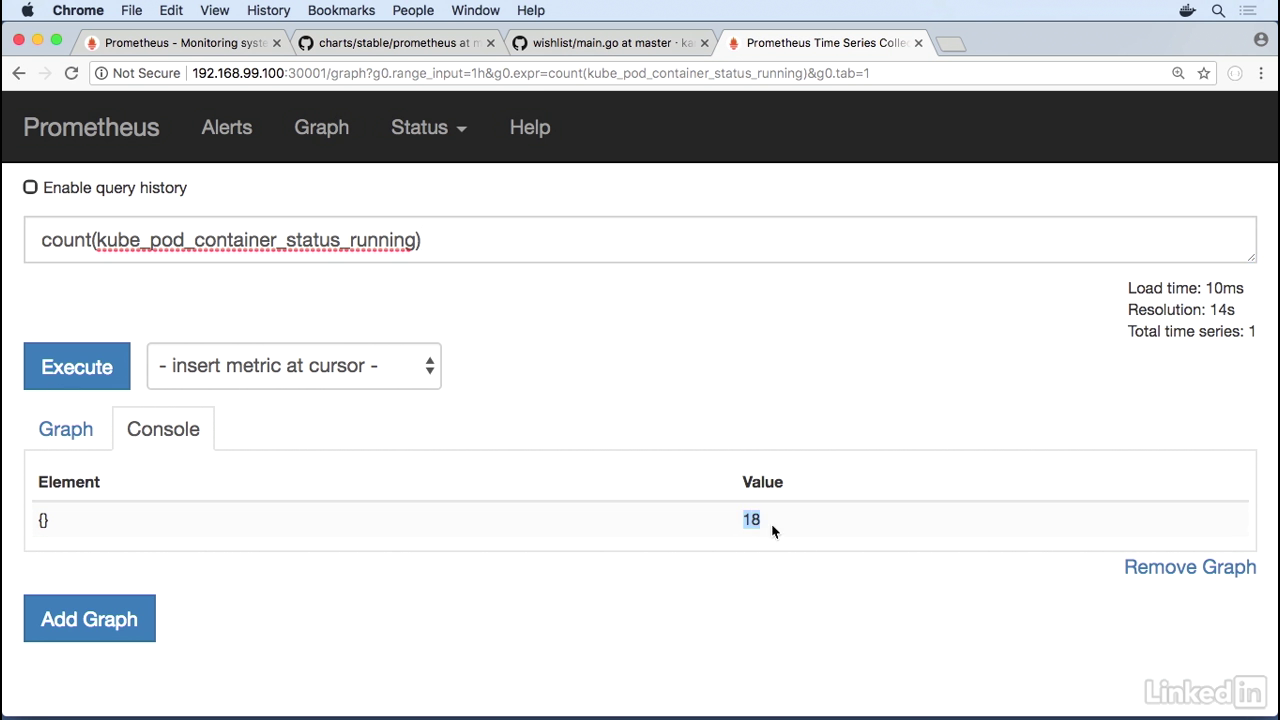
- And sometimes when you have a list it's hard to kind of see what's in here, so you can add some prom QL to this, or you can do a count.
- This gives you a value of 18.
Command line
- This should correspond to do a kubectl get pods across all name spaces.
- This number here for containers that are in a running state or rather pods that are run in a running state, this should add up to 18 as well.
- So that's great.
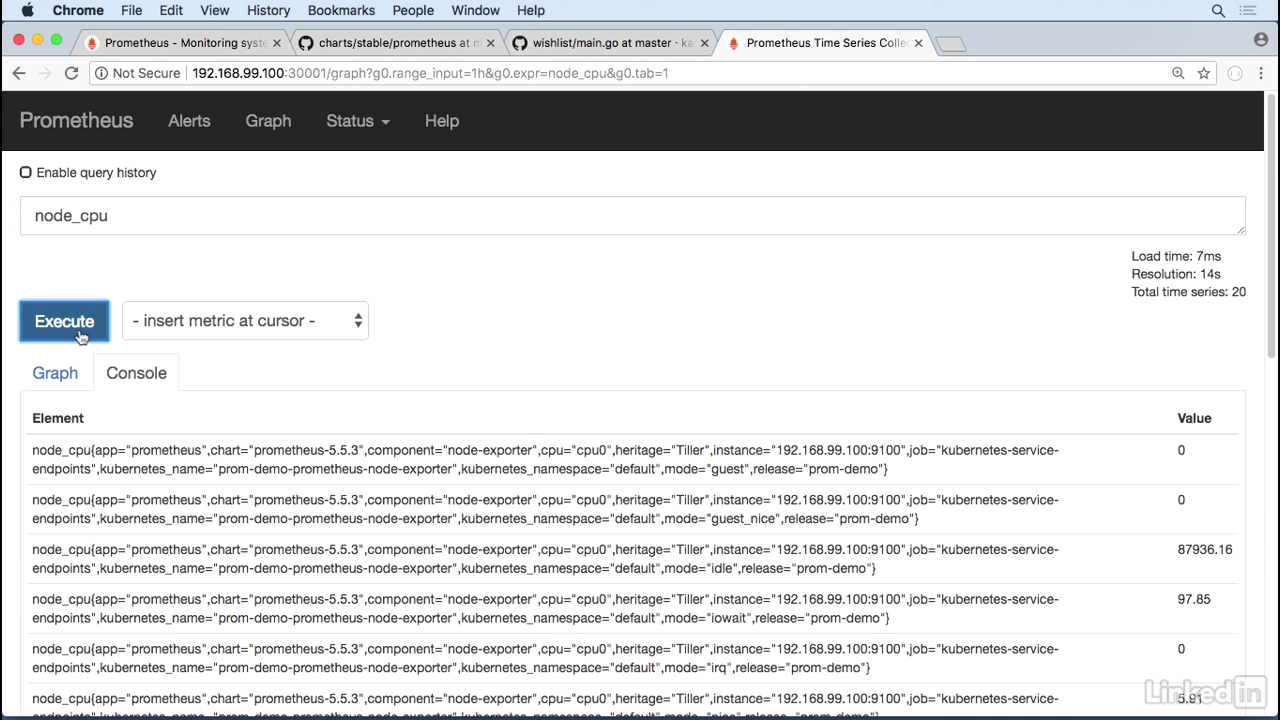
Node information
- Let's take a look at node information.
- To do this I can do a node cpu to get CPU information. Execute this.
- Get a lot of information back.
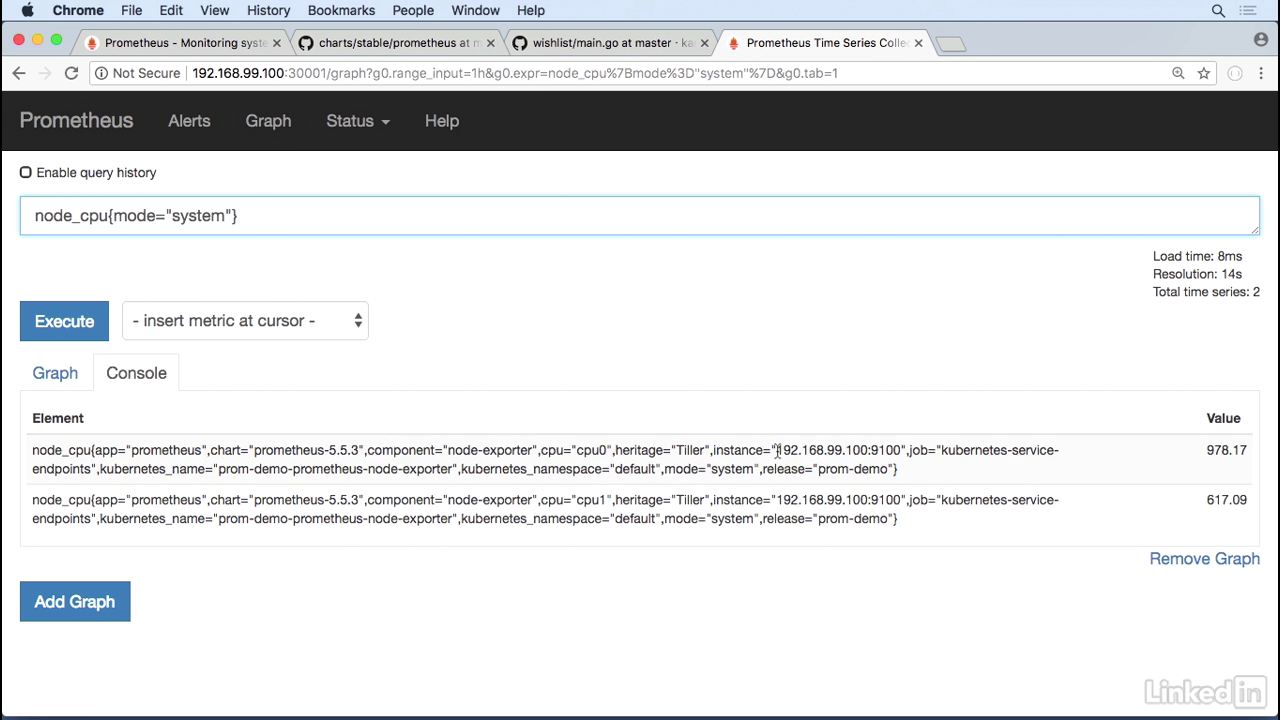
With mode system
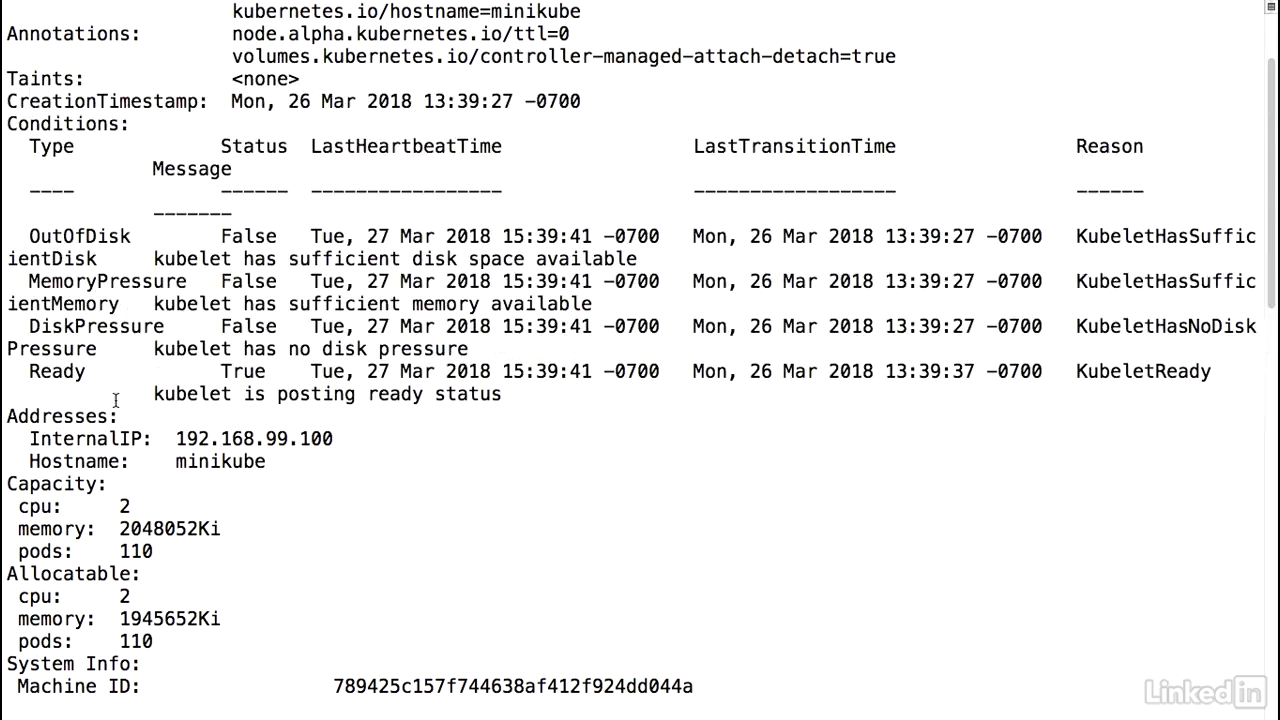
- So let's just look at mode of system.
- And when I type in mode system I'm just looking at the amount of time that spent in the kernel for minikube.
- We'll notice here that the instance coming back is 192.168.99.100, which is my minikube IP.
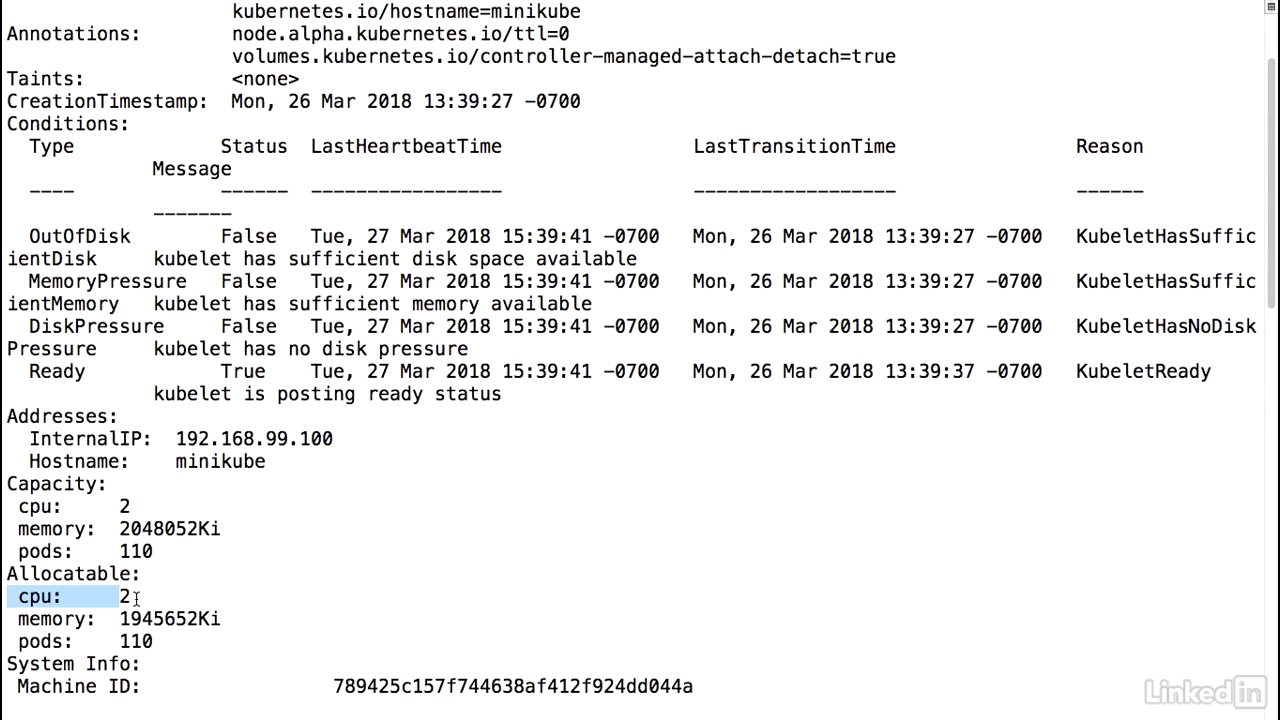
Command
- Look at this in minikube, kubectl describe nodes.
- I should see CPUs. CPU capacity of two. Also allocatable two CPUs.
Main.go
- Now a lot of times we want to also see our application metrics in here.
- How do we do that?
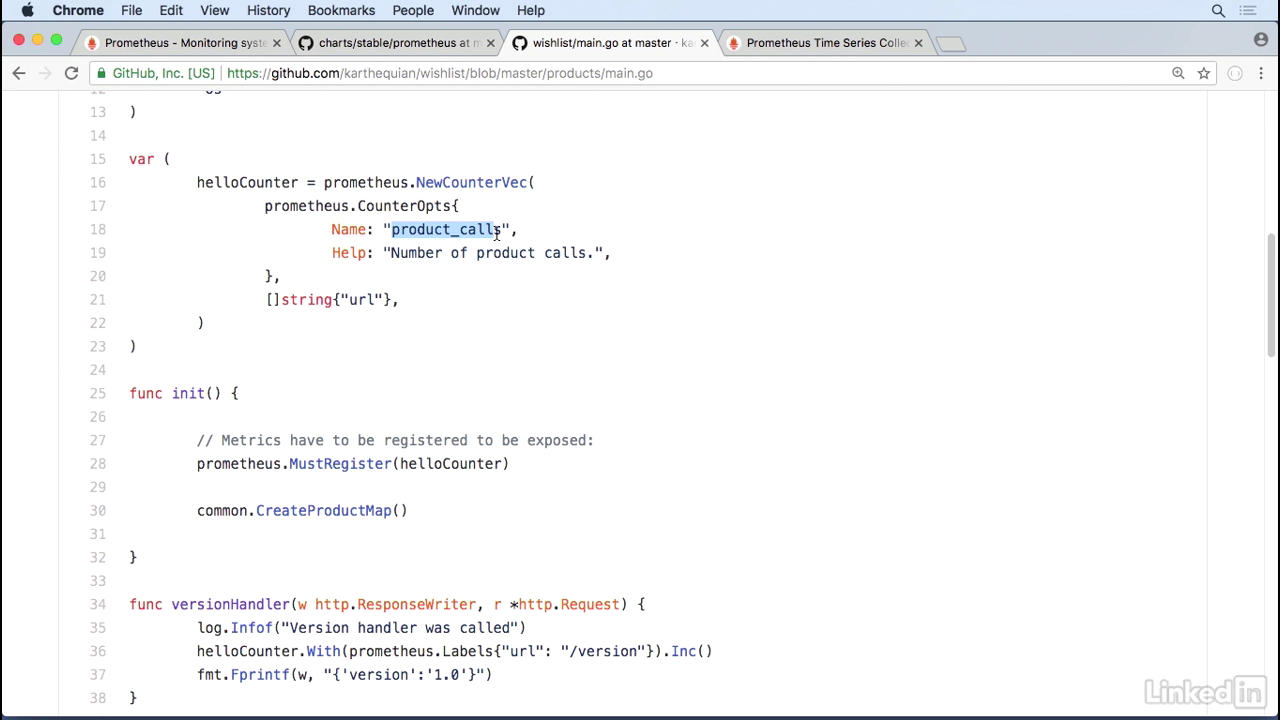
- Well first off we have to instrument the application.
- We'll look at the products, for example, and in here I have a Prometheus counter called product calls, which is the number of product calls.
- And this counter increments every time the product API is hit.
- So if you look at the new handler we have a hello counter with prometheus value, list increment.
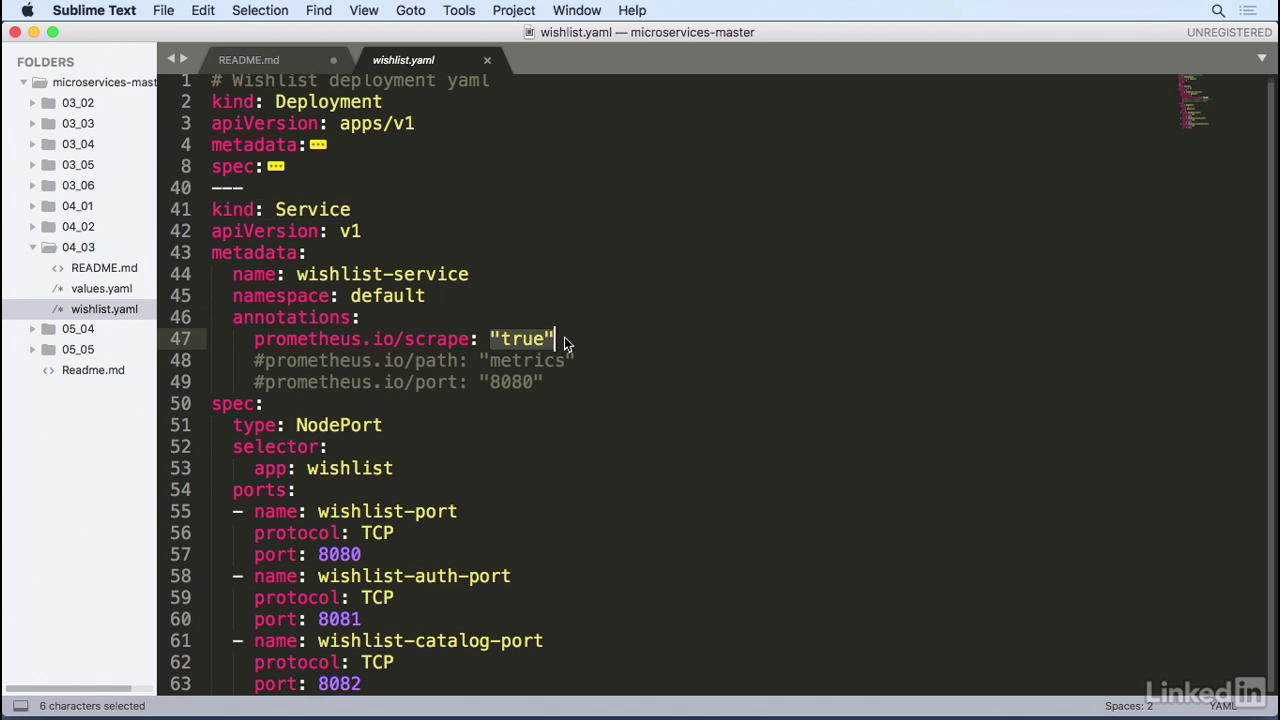
Yaml file
- Let's take a look at the yaml of the application.
- So the deployment is the same.
- However, we've added some information to the service.
- So for the service you'll notice that we have a couple of annotations here.
- And this says prometheus.io scrape colon true.
- This is essentially telling prometheus to scrape the service when it sees a value.
Deploy
- So let's go ahead and deploy this guy.
- Kubectl apply minus f wishlist yaml.
- Should create the deployment of the yaml.
- Make sure the service is up and running. Looks good.
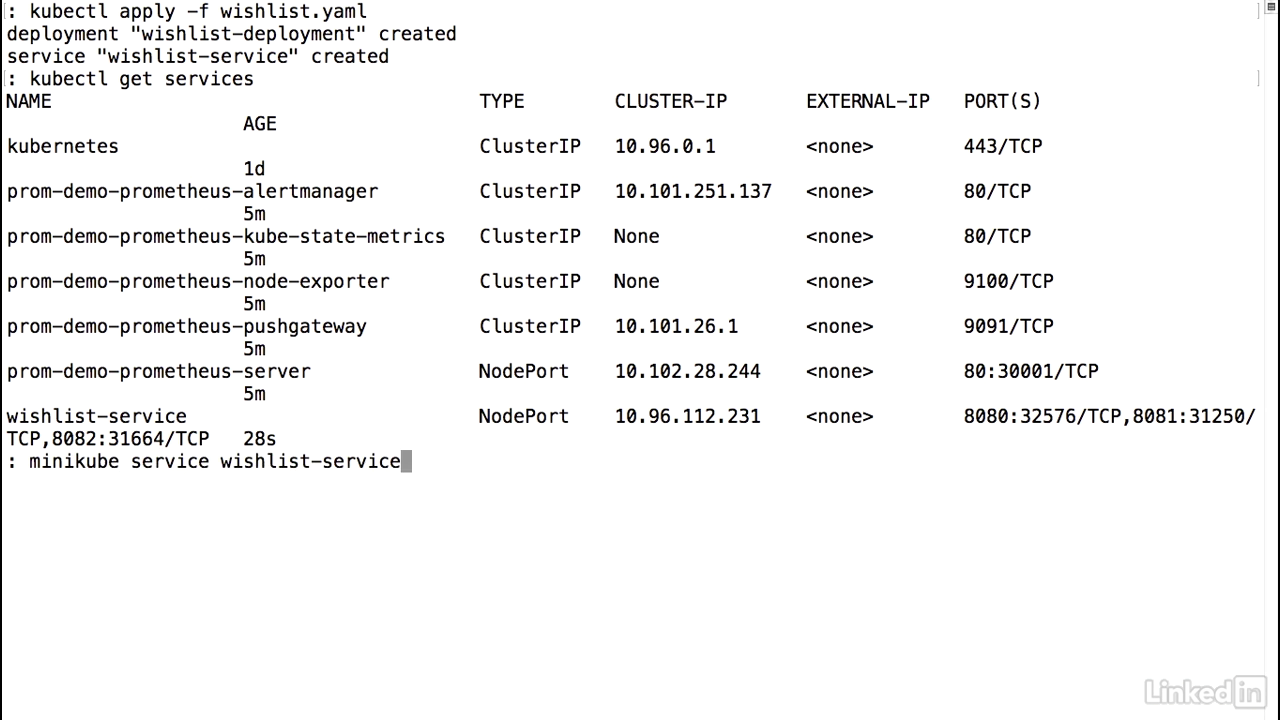
Load the page 5 times
- And then I will hit the minikube service, wishlist service.
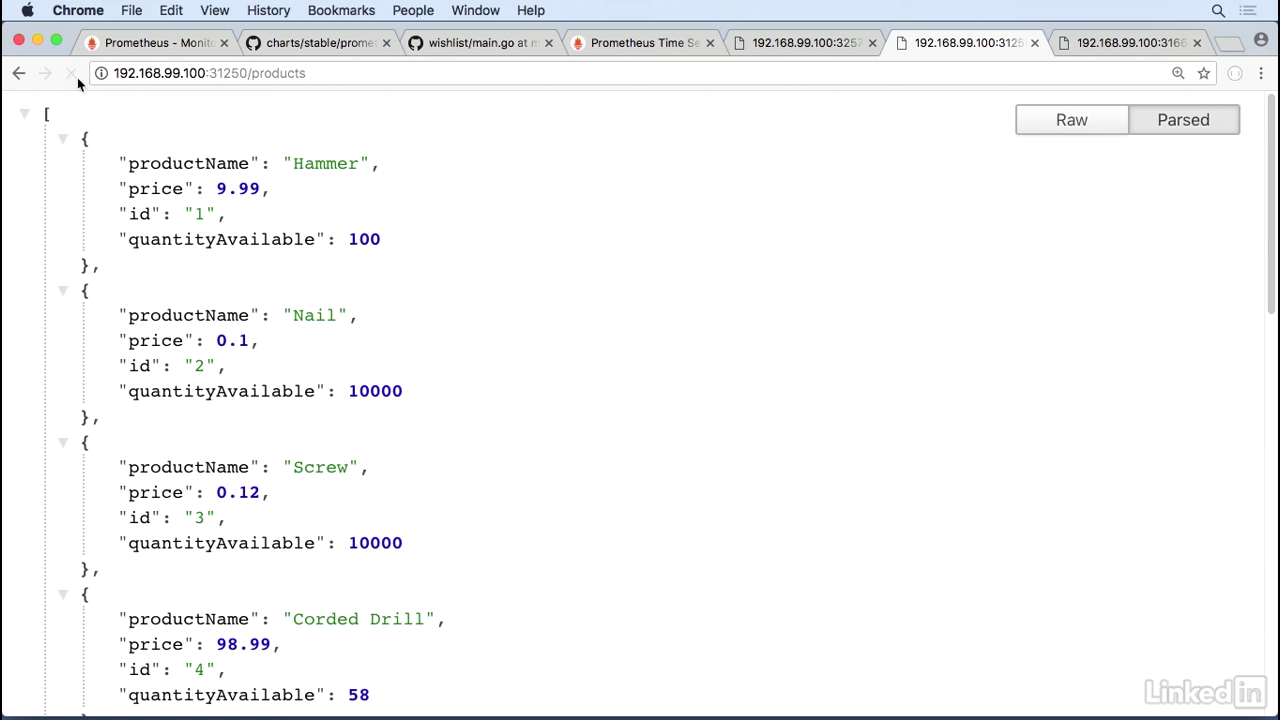
- Try and get the UI up and running.
- So that's the alt API, this is the catalog API.
- So let's hit products.
- I'm going to reload this page five times.
- Two, three, four, five.
Product_calls
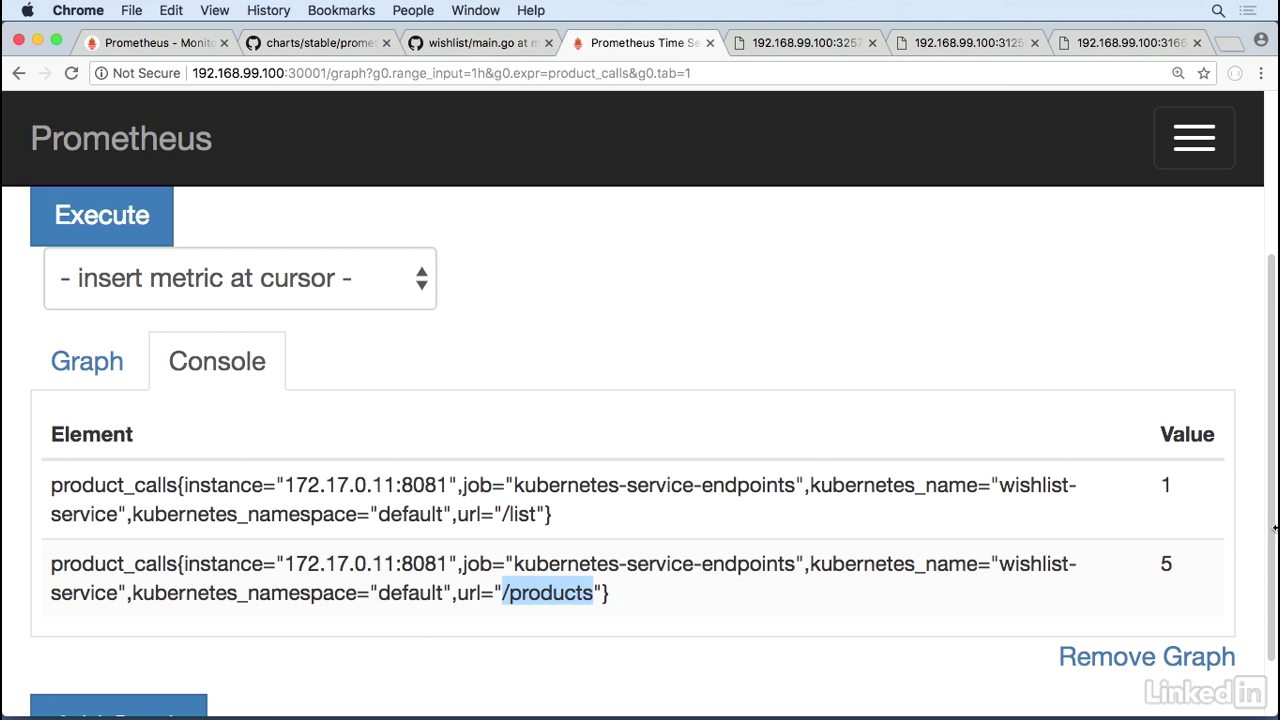
- Go back to my Prometheus UI and we see product calls.
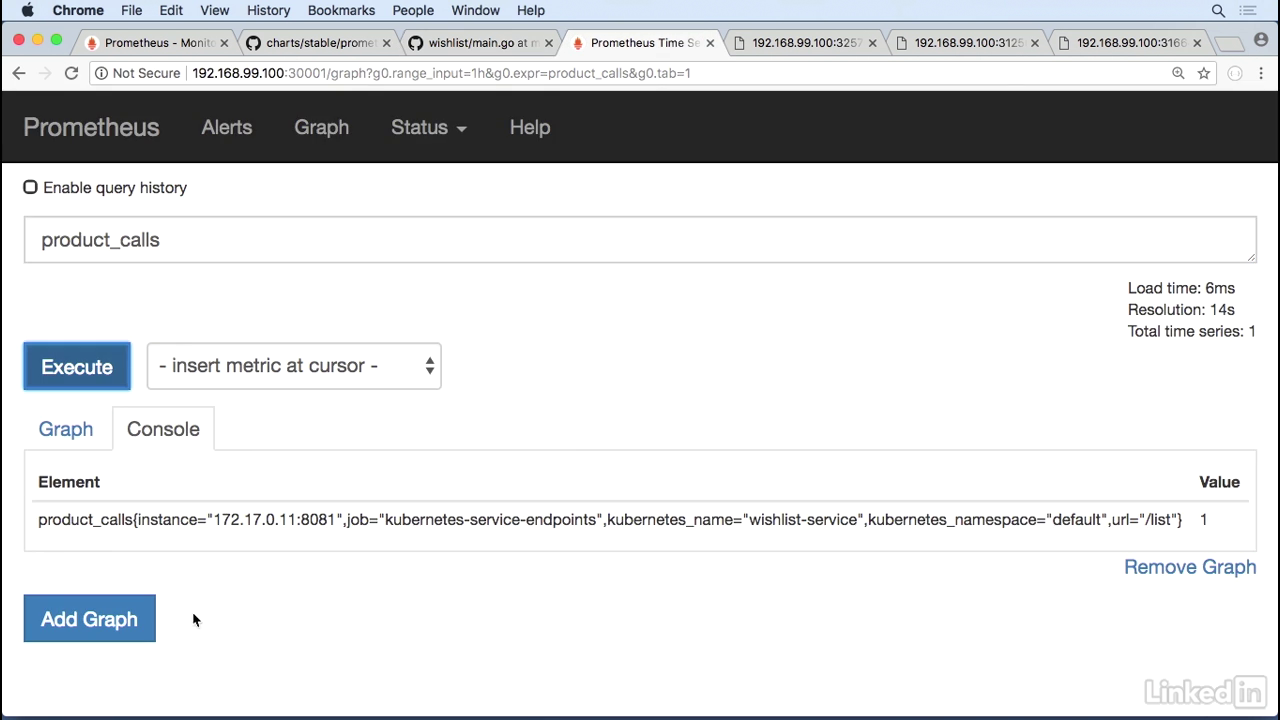
See the output
- Which is what I had configured here.
- So this gives us instance information, the job, Kubernetes name, wishlist service.
- It has the name space and the URL slash list, and the value for this is one.
- And now we see it for products as well, which is the URL that we were hitting.
- It's at five.
- Note that the value is not update immediately, we may wait for 30 seconds
- We've taken a look at Prometheus.
- We've seen it running in Kubernetes.
- We've checked out Prometheus giving us Kubernetes statistics, node information, and also monitoring your application to try and pull out your application metrics.
Lecture 020 - Logging with Fluentd
Section
- Let's take a look at logging from our application.
- To do this, we'll use the EFK stack which is elastic search, fluent D, and Kibana.
- We're going to run this is the minikube.
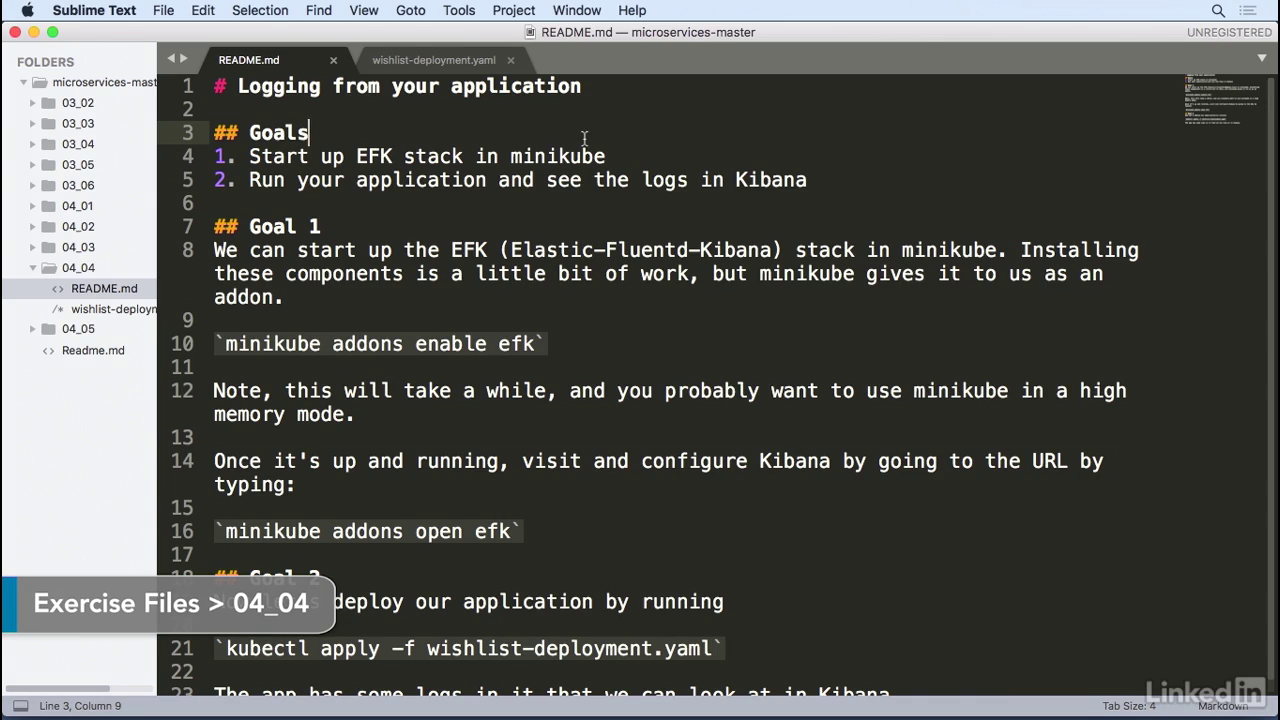
Minikute addons
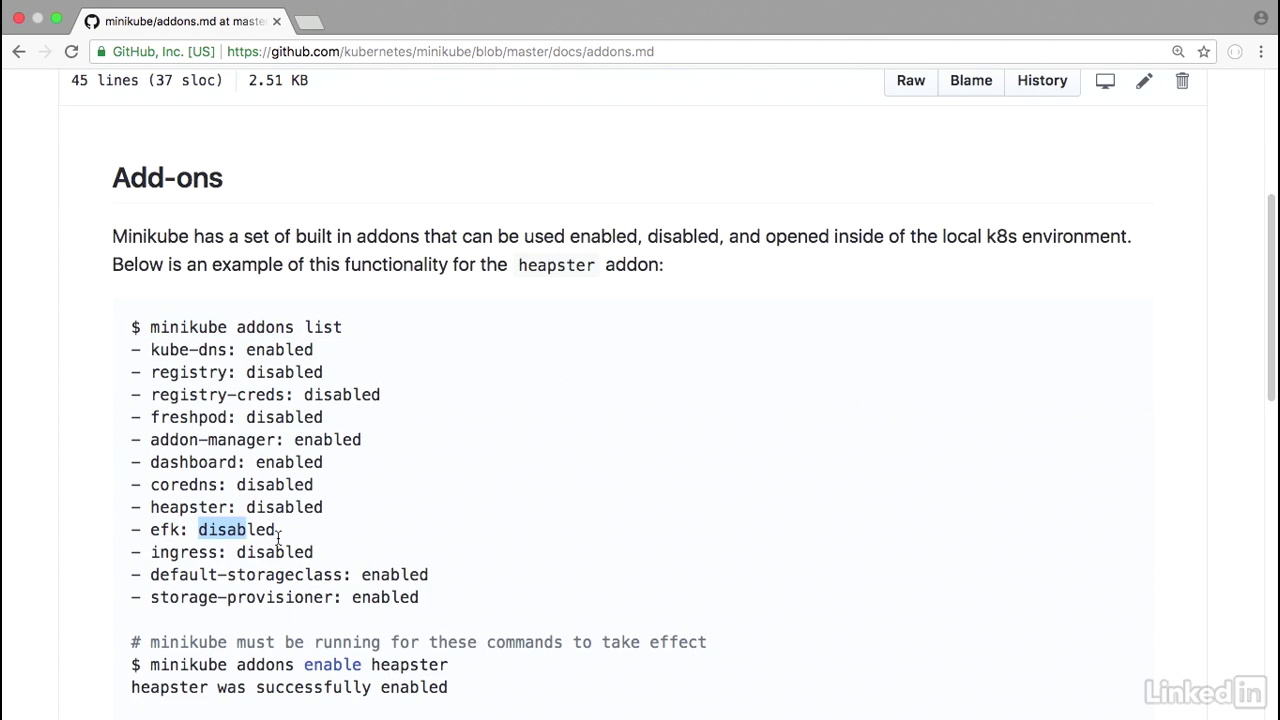
- Typically, you'd install the EFK stack on your own Kubernetes instance, but minikube gives this to us as an add on.
- As we can see in the minikube's add-on list we have EFK that starts off as disabled.
See status of addons
- So let's go to our terminal.
- Minikube add ons list.
- So I've enabled this by default.
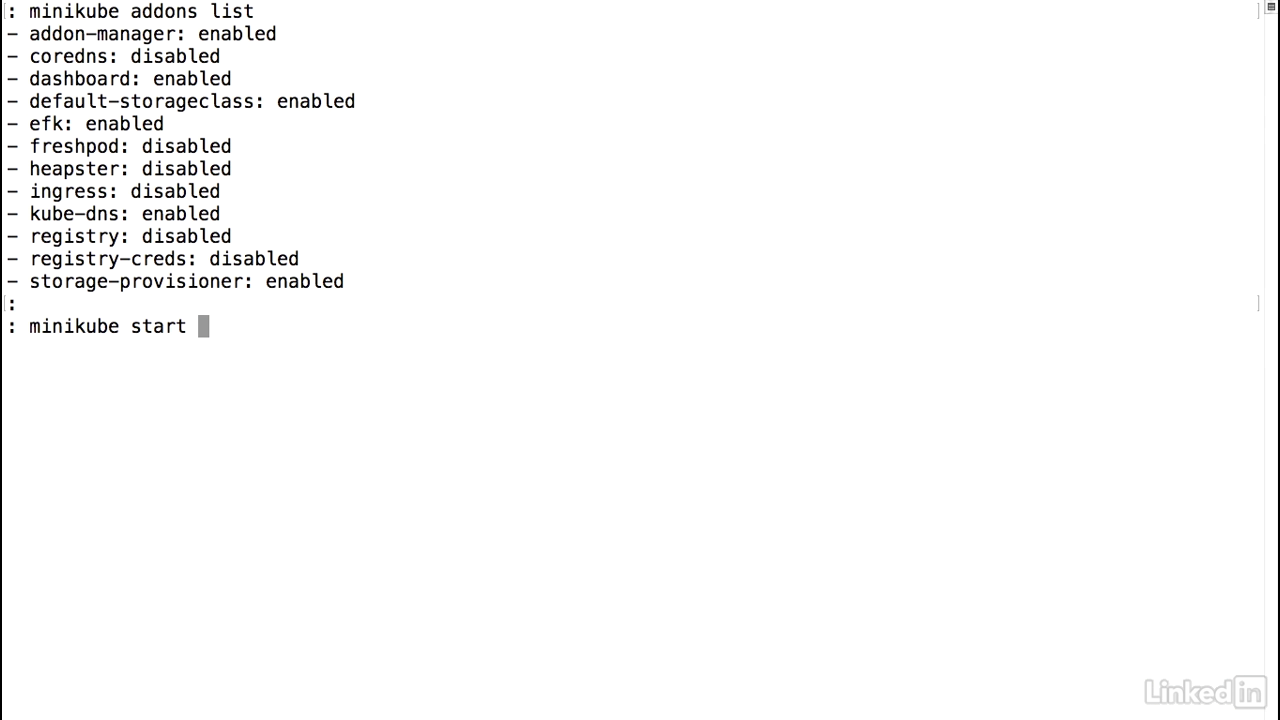
Start minikube
- I'm going to start up minikube by doing a minikube start.
- However, I want to pass some additional parameters here.
- The ELK stack, or the EFK stack, ends up taking a lot of resources, so we want to pump up minikube with additional CPU and memory.
- It's recommended that you use at least four gigs, but I'm going to crank this up real high.
- And I'm going to use 16 gigs instead.
- And I'll use 4 CPUs.
- And I will wait for minikube to start up the cluster.
- And then we can take a look to see what it's doing.
- All right, our minikube cluster has started.
- So let's take a look.
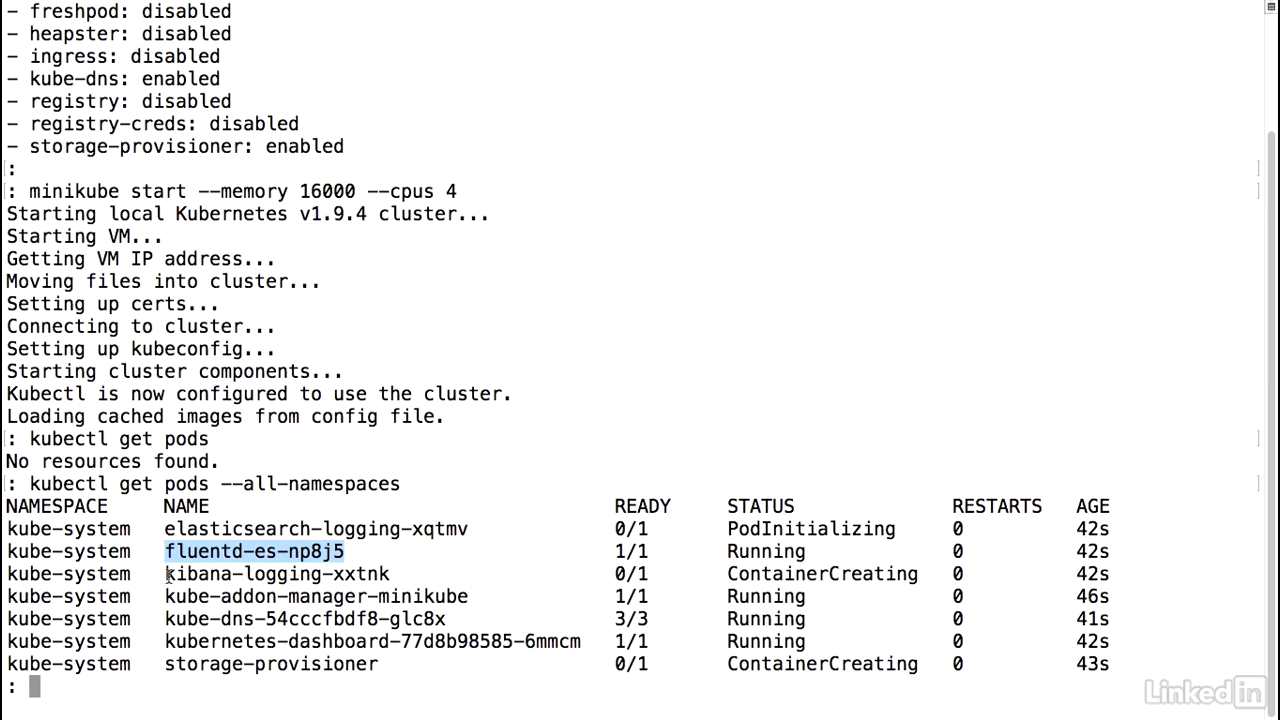
- Kubectl get pods.
- No resources found which makes sense because we haven't deployed anything yet.
- But if we do a kubectl get pods and we look at all name spaces.
- We'll notice that in the kube system name space we have elastic search, fluent D, and Kibana starting up.
See pods
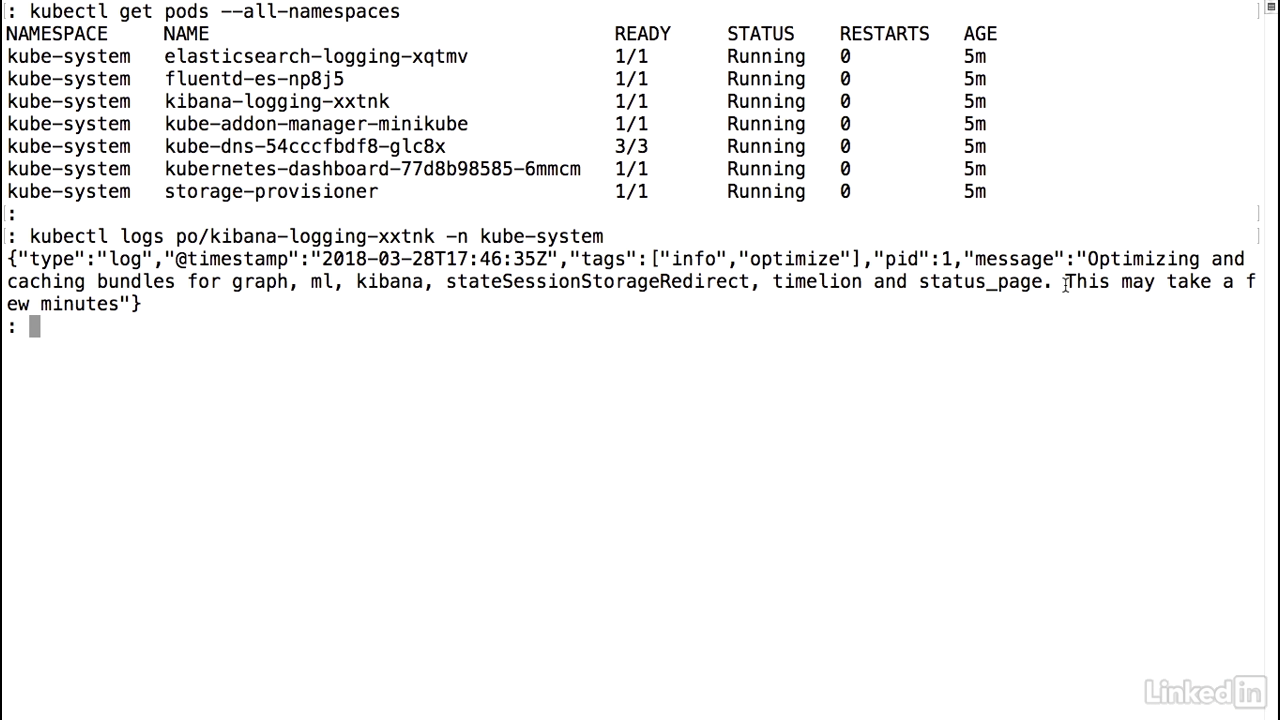
- Let's take a look at the status of our pods now.
- Kubectl get pods and I'll just do an all name space.
- And we see that all of our pods in the kube system name space are up and running.
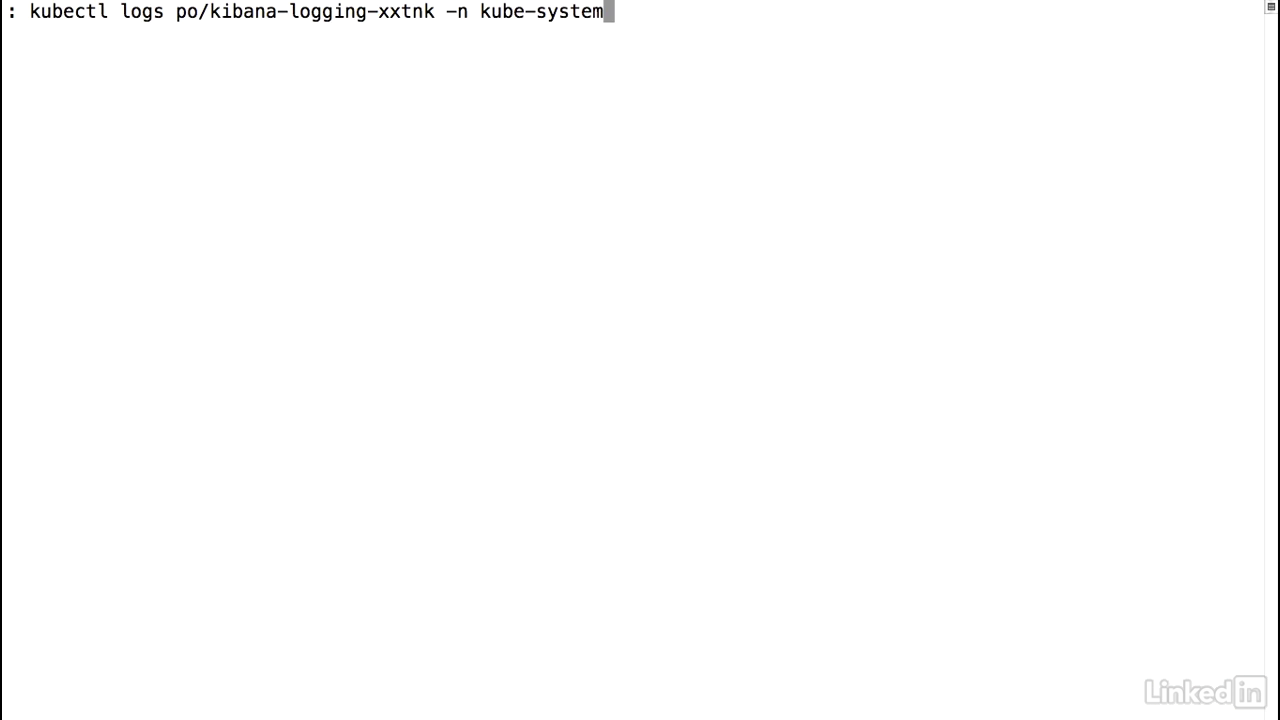
- I'm going to take a look at the logs for the Kibana pod real quick.
- To do this I would run a kubectl logs P O slash kibana.
- And since this is running in the kube system name space, kube system.
- You'll notice that initially it'll say optimizing and caching bundlesfor graph, minikube, kinbana, etc., etc.
- And it says this might take a few minutes.
- It does end up taking a little bit of time.
- I've noticed on my personal tries that this ends up taking about five or 10 minutes to start up.
Command to see log
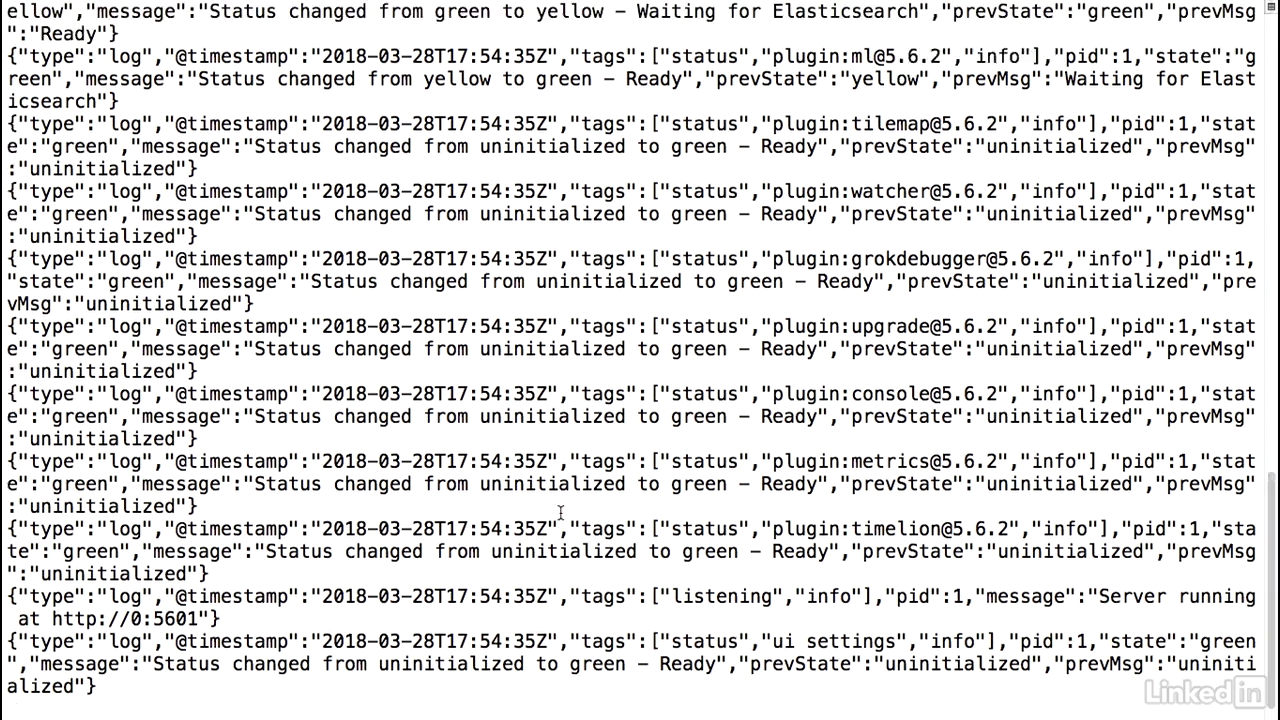
- Let's take a look at our Kibana logs again.
The log output
- We'll notice that we have a lot more information coming in.
- So it looks like Kibana might be ready to go.
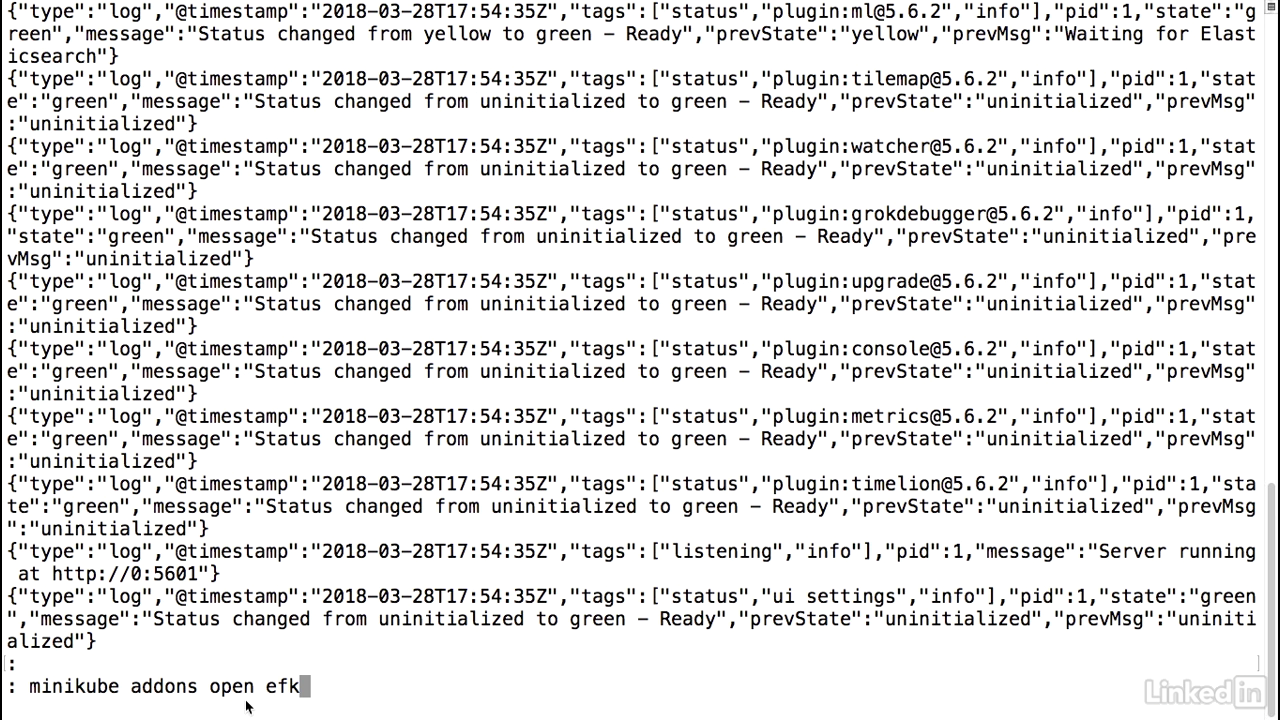
Open kibana
- So let's go ahead and go to the UI.
- We can either run the minikube services command and pass the service name or we can run the minikube addons open efk command.
- Essentially, this is just doing a minikube service and then pulling out the Kibana service name and opening the Kibana service in our UI.
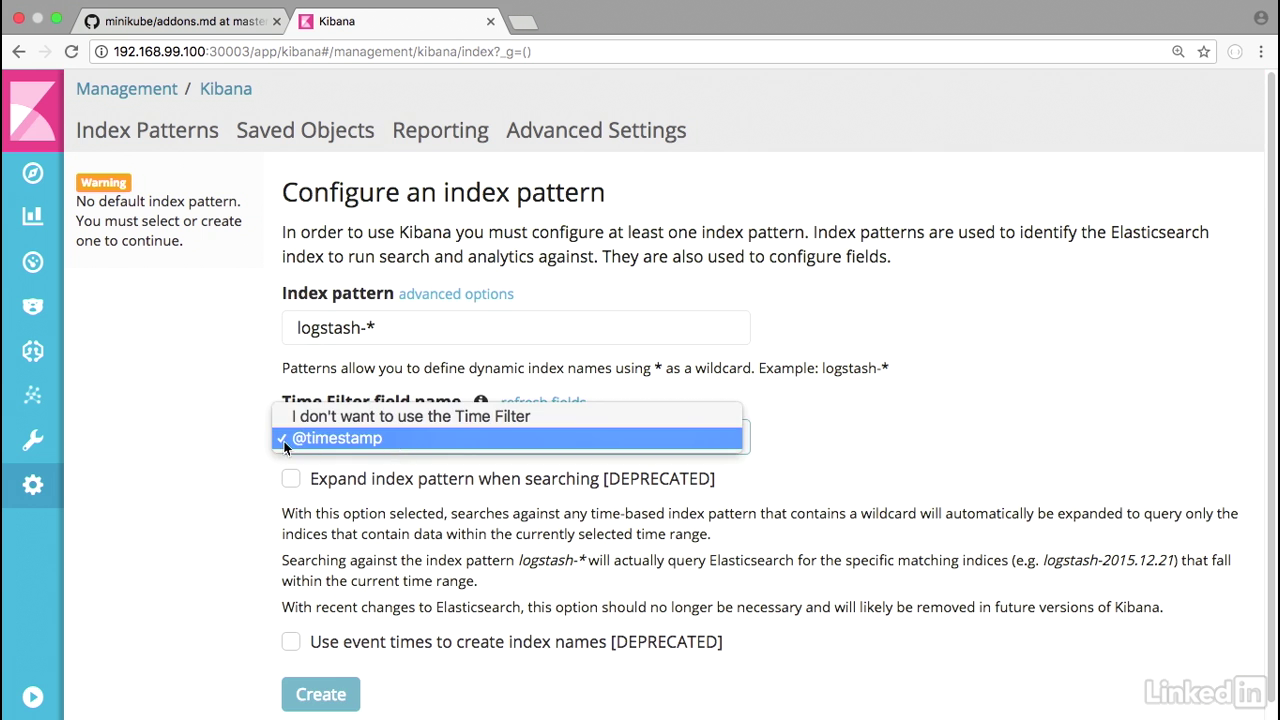
Configure
- We'll notice that Kibana's loading up. Looks good.
- I'm just going to keep the defaults as they are.
- And I'll hit create.
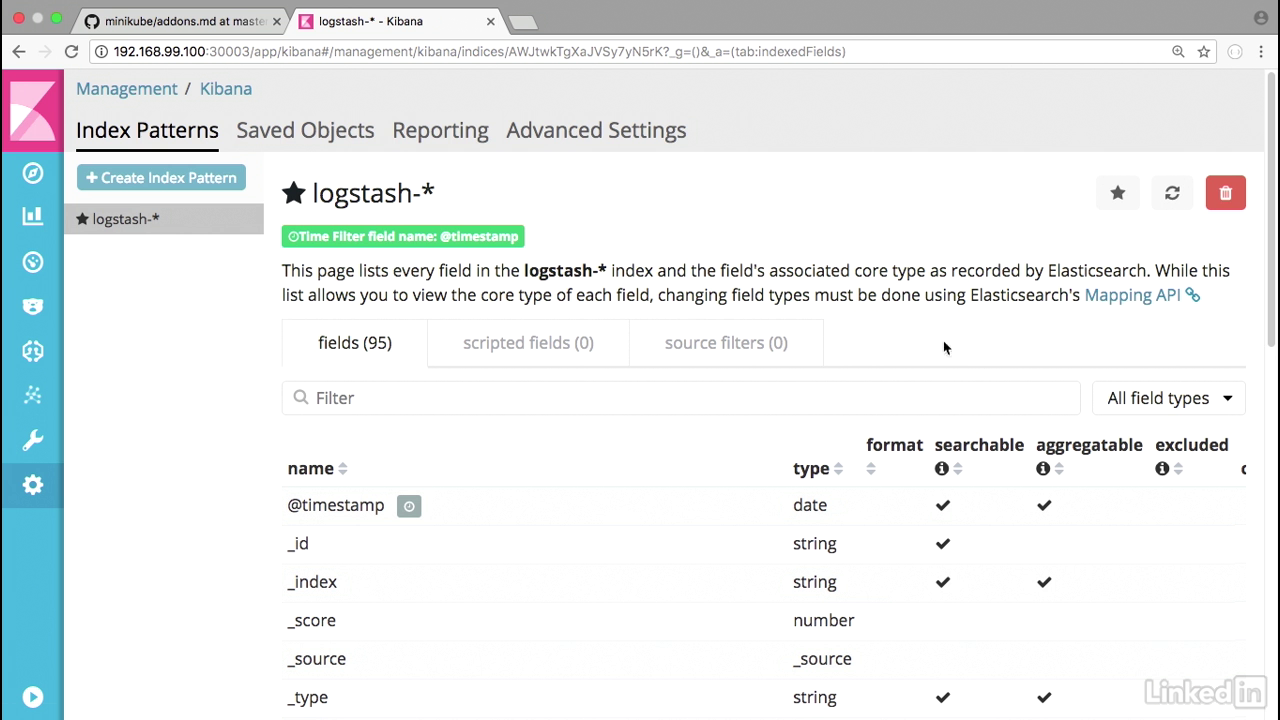
Opened up Kibana
- We have opened up Kibana, which is great.
- All right, let's go ahead and deploy our application now.
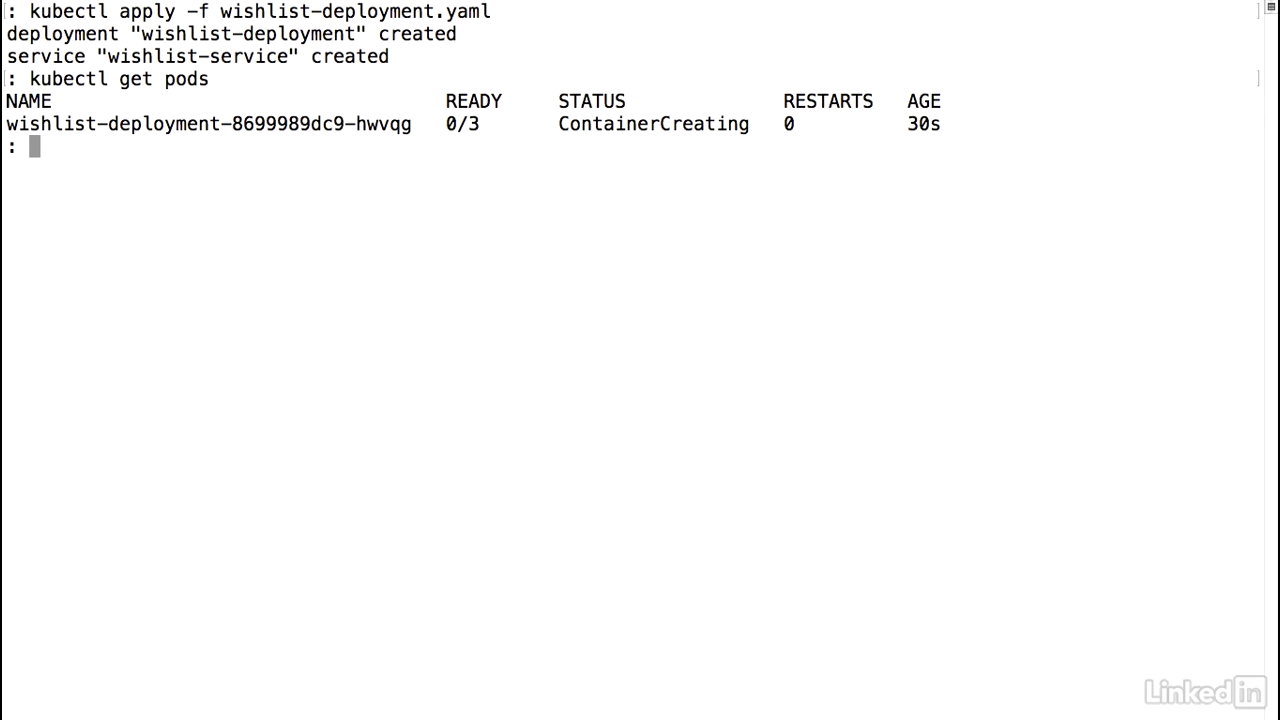
Deploy
- So I have a sample app like before.
- It's just a simple wishlist deployment and a service.
- Kubectl apply minus f.
- I'm going to take a look to see my pod status.
- It's in a creating state.
View pods
- We're going to speed this up as well and the pods might take about two minutes to start up, but we'll catch up at that point.
- I'm going to clear my screen.
- Now let's take a look at our pods again.
- So our application, the deployment is in a running state in about two minutes. Looks great.
- How about our service?
- These look online as well.
- So let's do a minikube service space wishlist service.
- This will load our UI up.
Run app
- Ensure the version endpoint.
- Here I'm going to hit the products endpoint.
View in kibana
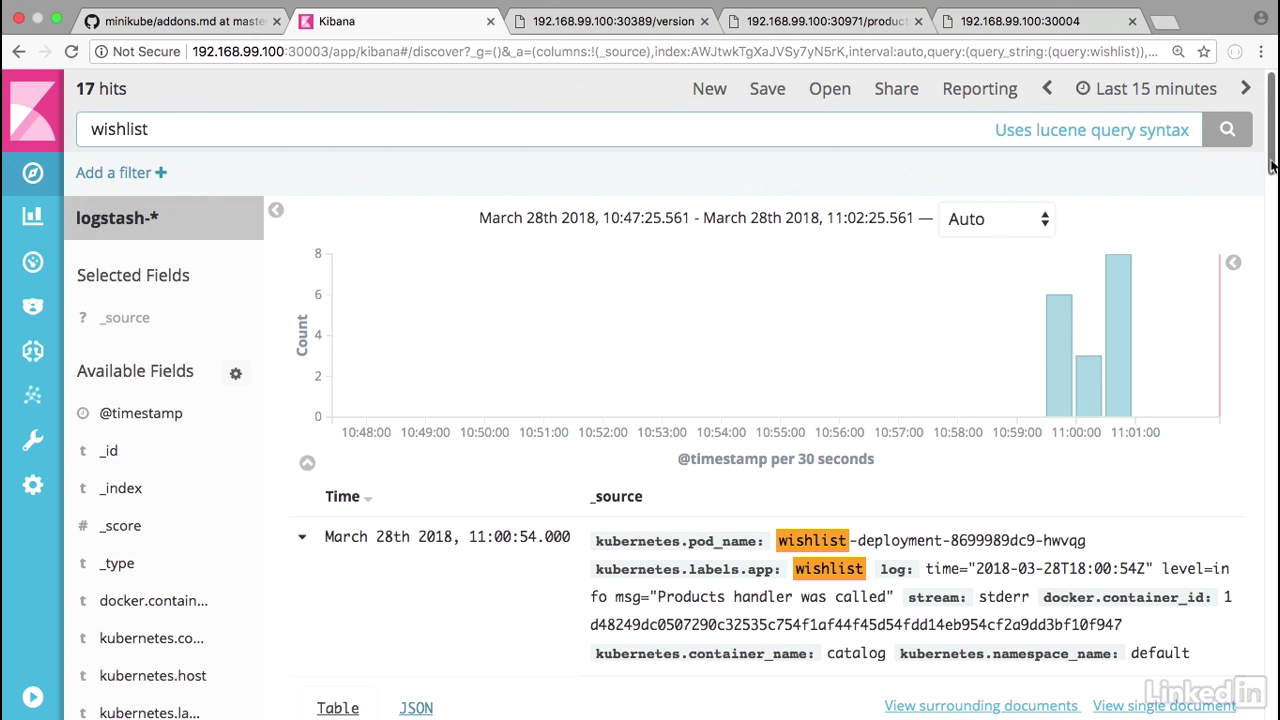
- And let's go ahead into Kibana, and we want to go to the discover section.
- By default Kibana shows you all the information that it has.
- And it's also showing us in the last 15 minutes, which is fine for our initial timeframe.
- We'll notice that we have statements such as product handler was called.
- And another version handler was called, etc., coming from our pods.
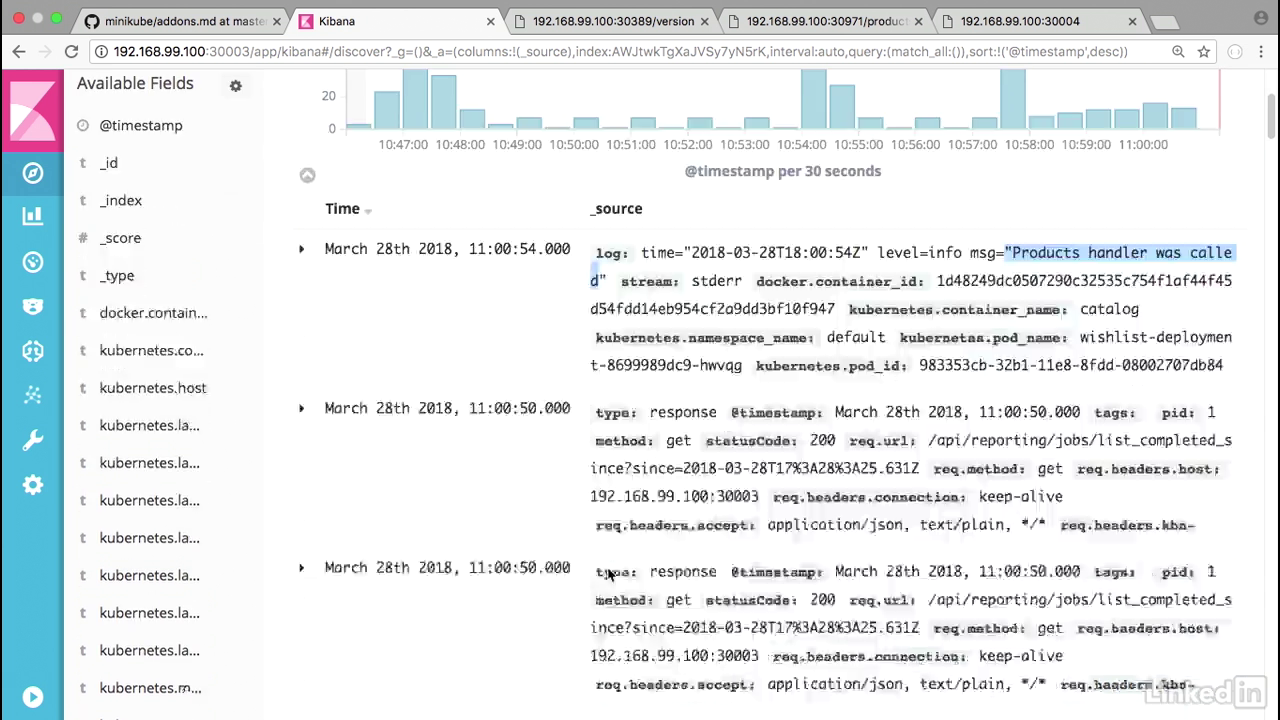
View in kibana
- And if we expand this we'll notice that this is coming from Kubernetes container name catalog.
Fileter by wishlist
- So let's actually filter this by just typing wishlist.
- And this is just information or logs coming from our specific application.
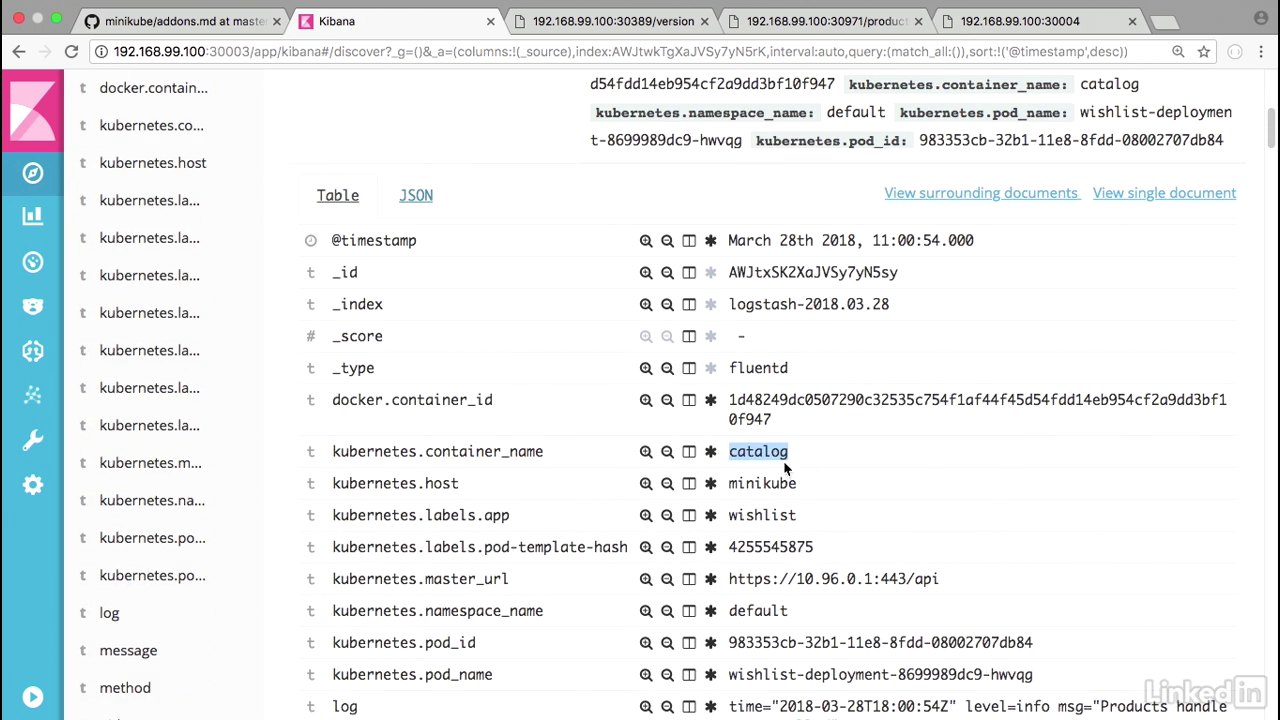
Fileter by wishlist
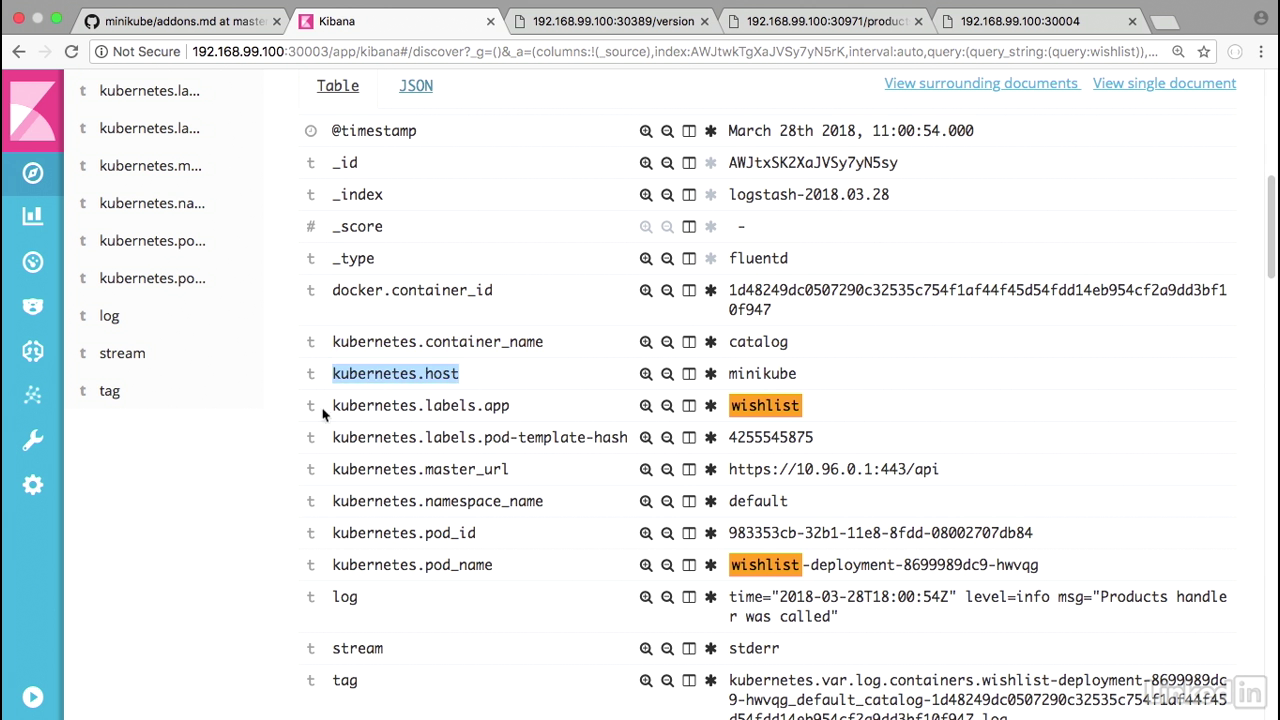
- Expand one of these so we can get a little bit deeper look.
- You'll notice that we have Kubernetes container name, the host, the labels.app.
- This is something that is coming from our yaml file, and then we had called it wishlist.
- The URL name space etc., etc., and then we also have the actual log statement in terms of the message.
- And as we scroll through this we see all of our logs.
- This is our application pushing logs to Kibana.
- So now you have an overview of what the EFK stack is and how it could be useful for your microservices.
- I like to note that we used the add on for our demo, but in a production setting best practice would be to install these components individually and incorporate strategies for backup and replication.
- For more information on this check out their documentation.
Lecture 021 - Tracing issues with Jaeger
About jaeger
- Let's take a look at tracing through the application code in Jaeger.
- Jaeger's actually a German word that means hunter, and it's a distributor tracing analyzer that was released by Uber.
- It's compatible with the open tracing standard and both open tracing and Jaeger are CNCF projects.
- If you're new to the space, think of Jaeger as an open source new relic.
- Let's go ahead and see this in action.
Jaeger command
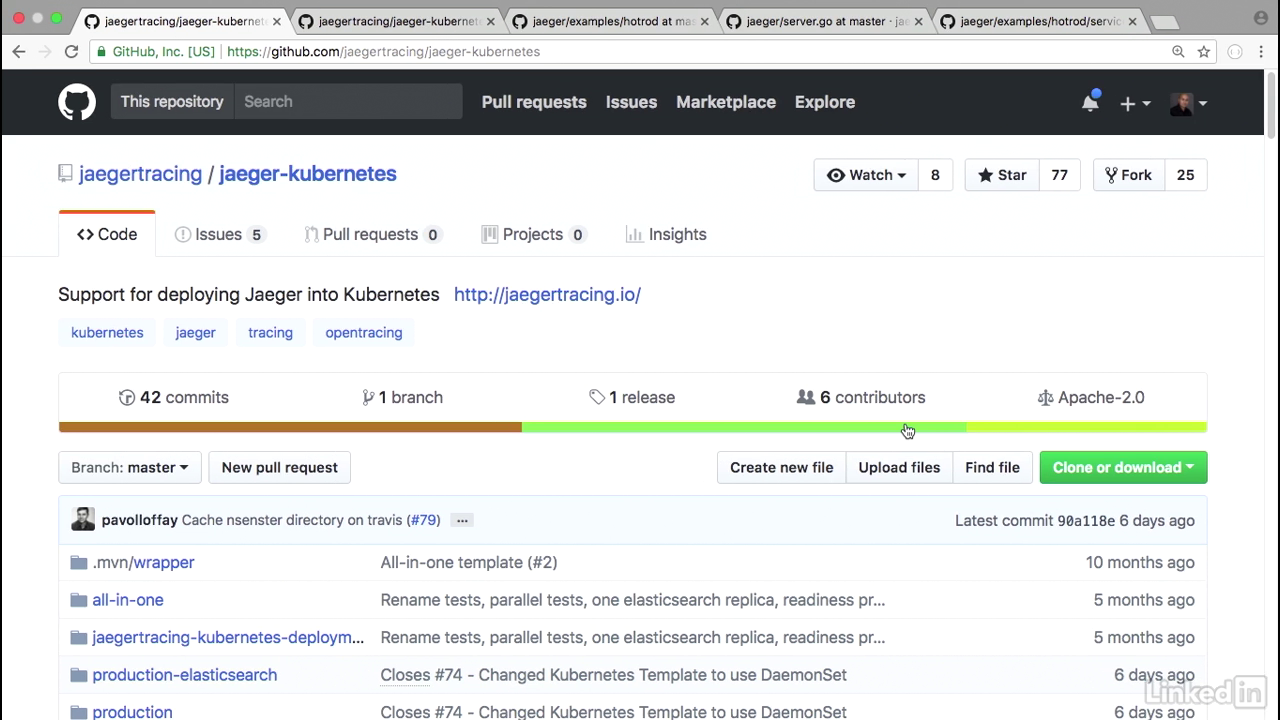
- We can go to the Kubernetes Jaeger tracing and Jaeger Kubernetes page to get information on how we can deploy this in Kubernetes.
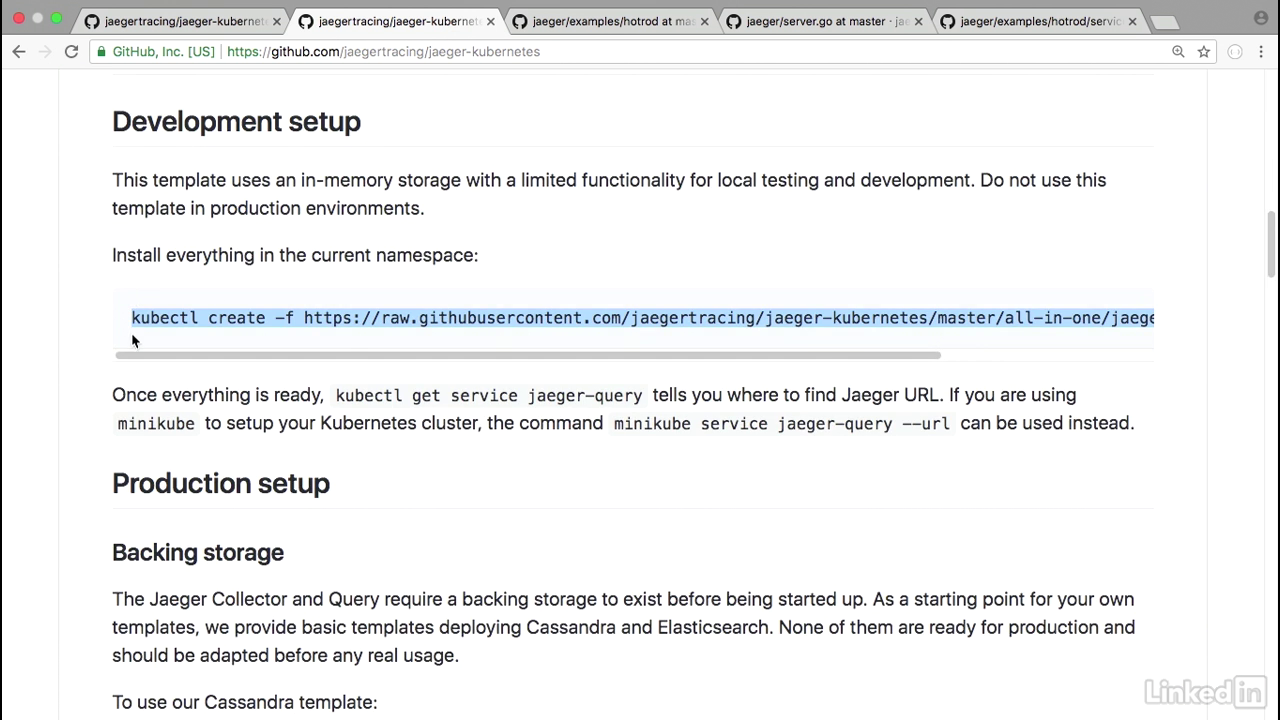
- For the development setup, I'm going to take the Kubernetes create command from the site
- 0135
- And the Jaeger artifacts create a deployment and a few services.
- Let's see if these guys are up and running.
- Kubctl get pods.
- So the deployment looks online.
- Kubectl get deployments.
- I see a specific deployment up and running.
- And if I do a kubectl get services, there seem to be a few services up and running as well.
- Great.
- So now what we want to do, is we want to take a look at Jaeger-query, which is the UI.
Jeager ui
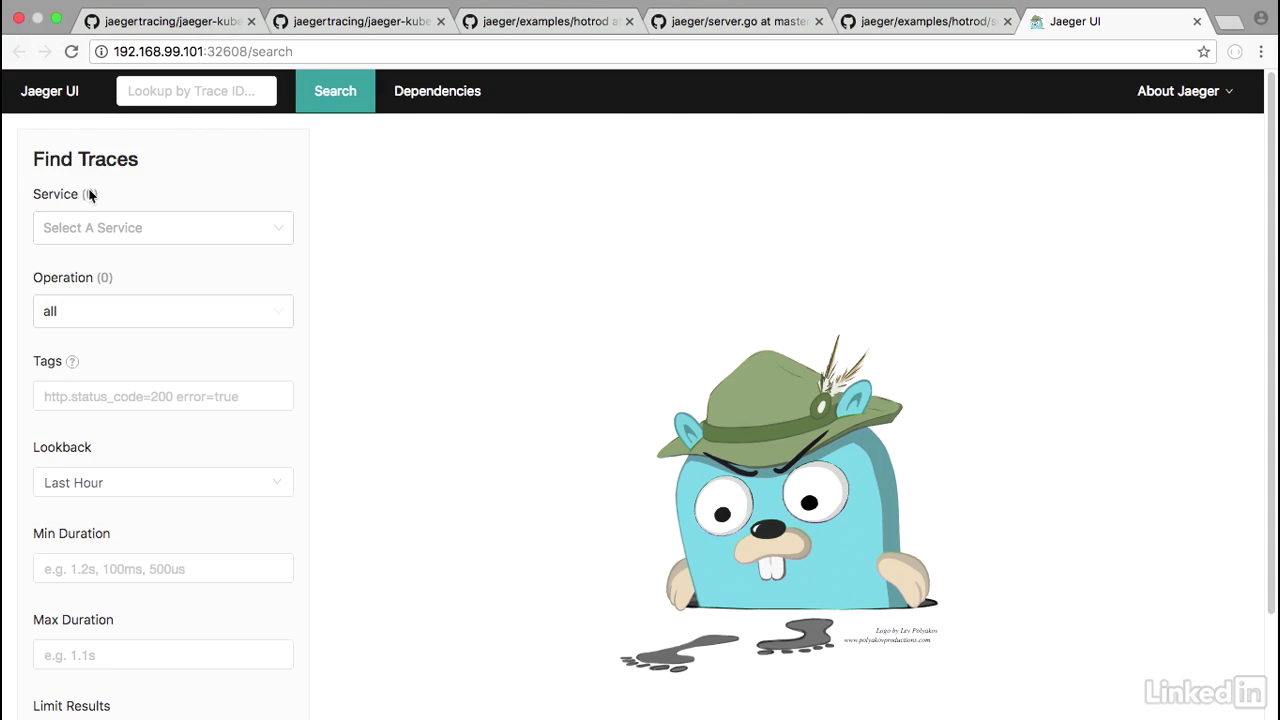
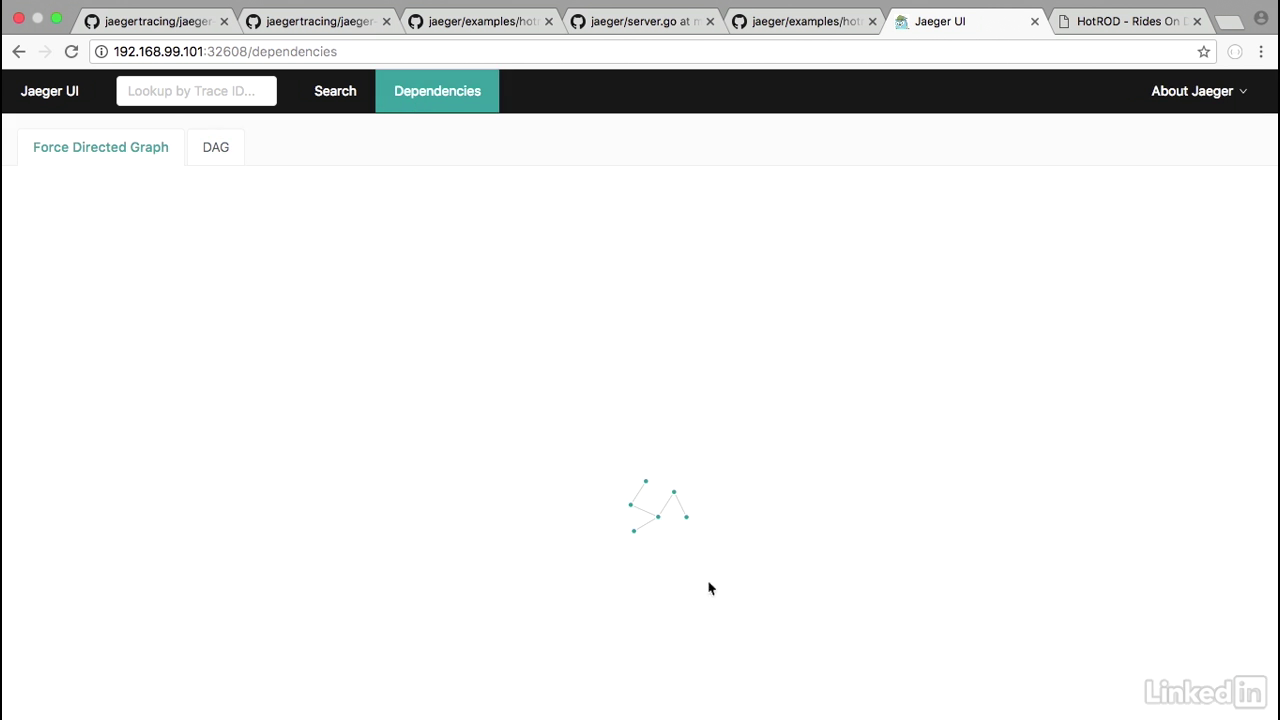
- I can do this by doing minikube service Jaeger-query.
- This will load up the Jaeger UI.
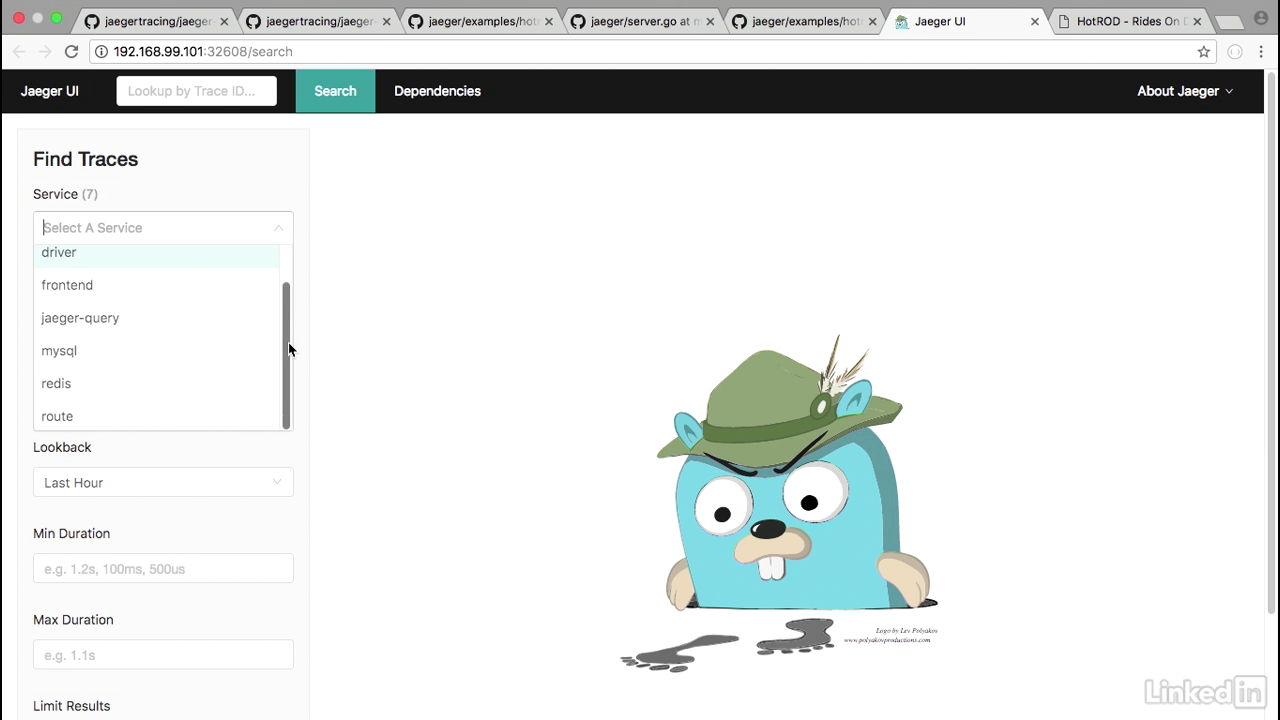
- As you can see, it's a gopher who's hot on his tracks.
- On the left side we have the Find Traces area, but currently there's no services associated with this.
- So we need to deploy something in order to see it in Jaeger.
- For this I'm going to use the canonical example of the HotROD application, because it has a lot more areas and pads that it walks through, so it'll show for a better demo.
- Currently you can run this as a docker plugin, but what I've done is, in my code, I've taken it and made it a Kubernetes deployment.
Deployment yaml file
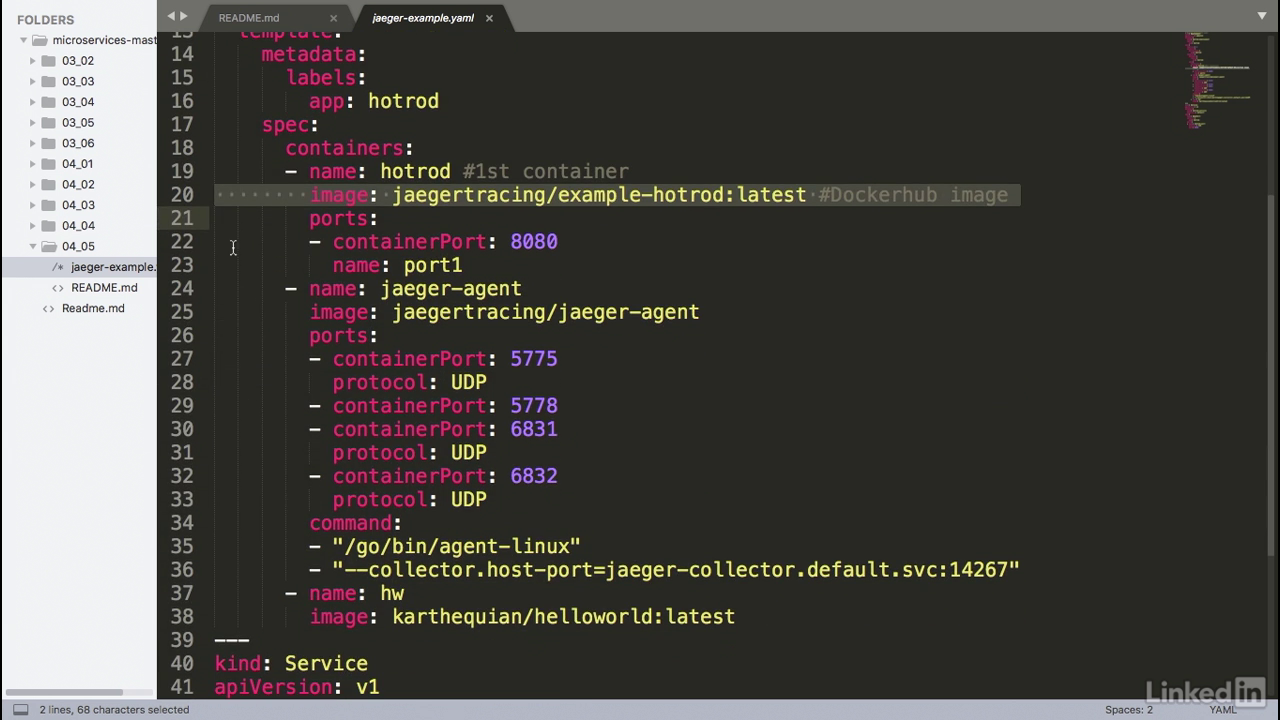
- So I have a deployment, and it's a HotROD deployment.
- And I've taken the same image that we saw earlier and basically made this into a deployment.
- I've also added the Jaeger agent that's required and this acts as a sidecar container to your actual deployment.
- The Jaeger agent takes information from the HotROD container and passes it back to the Jaeger collector.
Deploy
- So let's go ahead and deploy this.
- I will go ahead and clear my screen so that we can see the contents a little bit better.
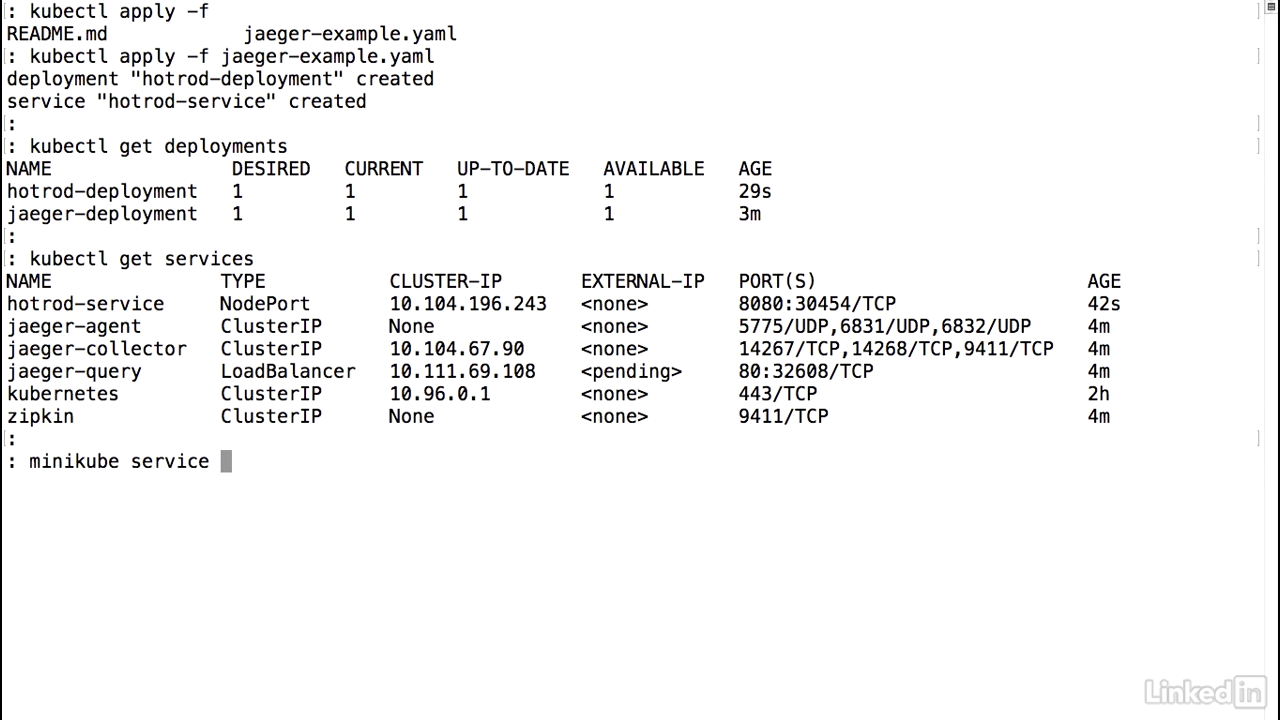
- Kubectl apply minus F Jaeger-example.
- It says the deployment and the service were created.
- Let's take a look at the deployments.
- Jaeger deployment online and then the HotROD application also online and available.
- Let's take a look at the services.
- The HotROD service is good to go
HotROD UI
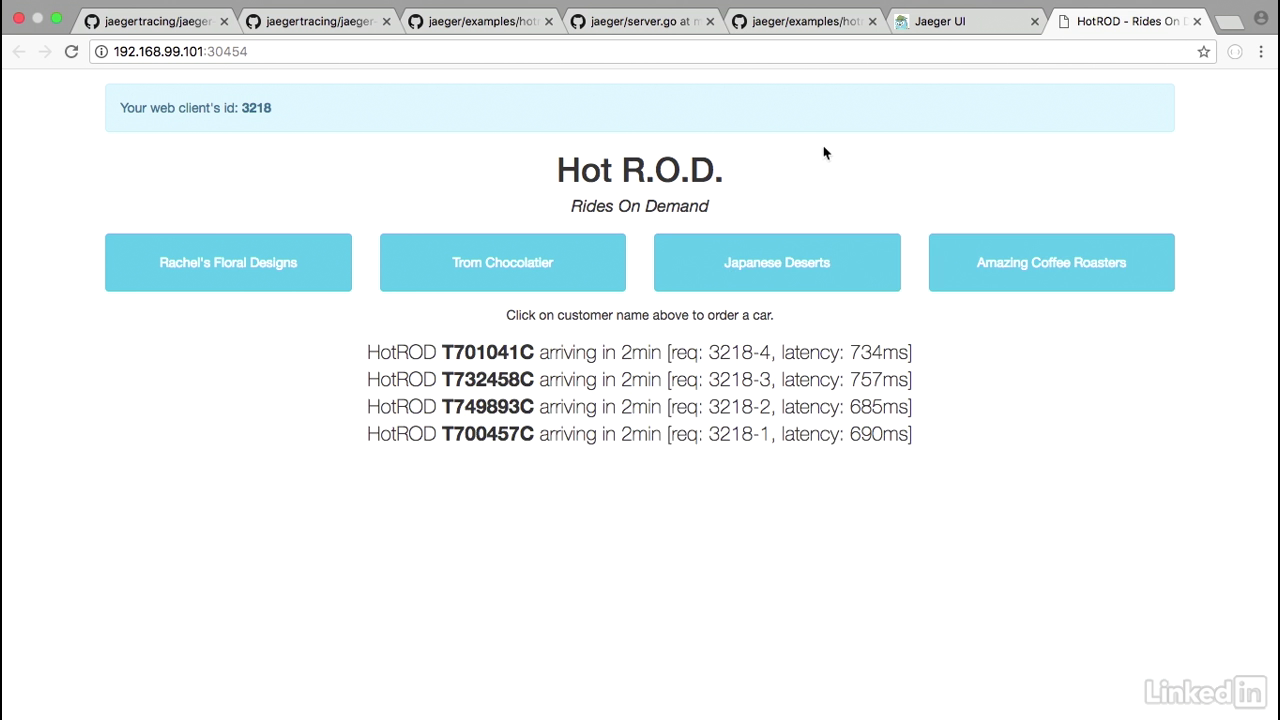
- Let's do a minikube service hotrod-service.
- This brings up the HotROD UI where we see a web client of 3218, and if I click on this, I'll actually generate some traffic.
- We'll notice that if I click on Trom Chocolatier, we get a new HotROD with an ID that arrives in two minutes or I can get Japanese Desserts, or I can get Coffee Roasters, for example.
- So this application is doing whatever it's intended to do.
Jaeger ui
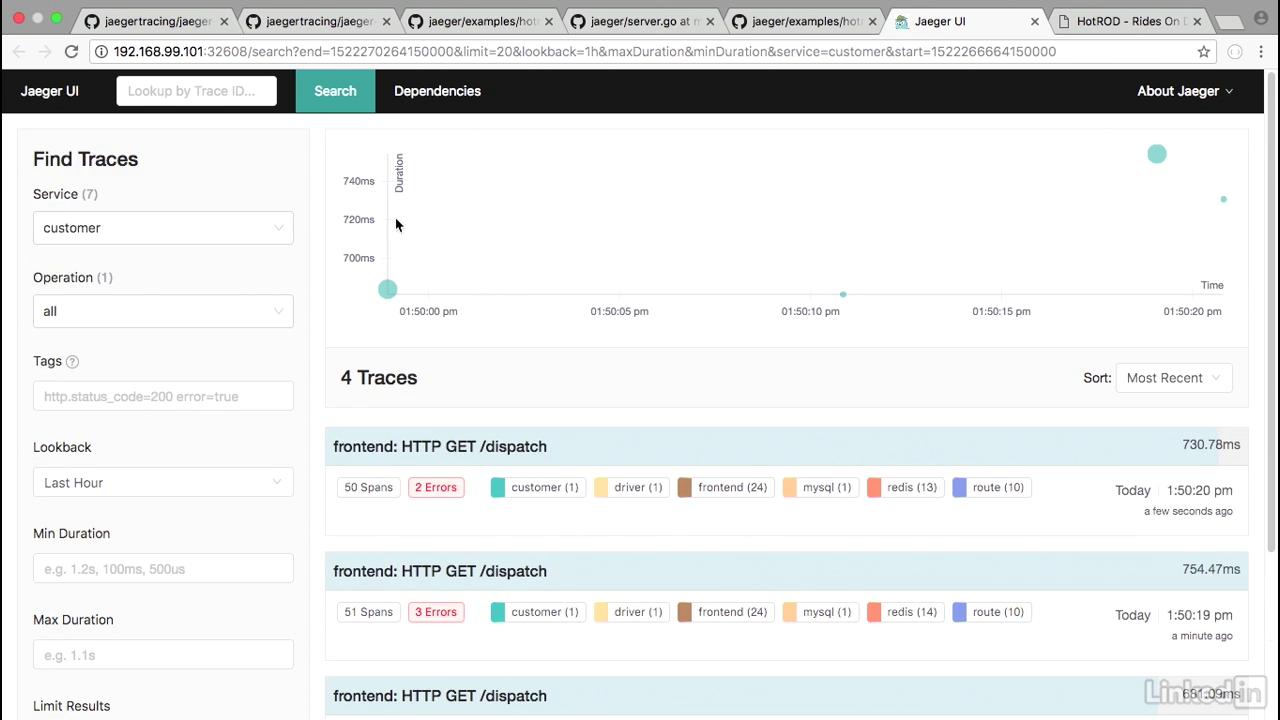
- Now if I go back into the Jaeger UI, and I reload this, we'll notice that there are seven services associated with this.
- And if I click in the Service drop-down, we'll notice things coming from the actual application.
Jaeger ui
- Choose Customer, and then I'm going to find traces, and from the trace information, I can get information on the front end, for example.
Jaeger ui
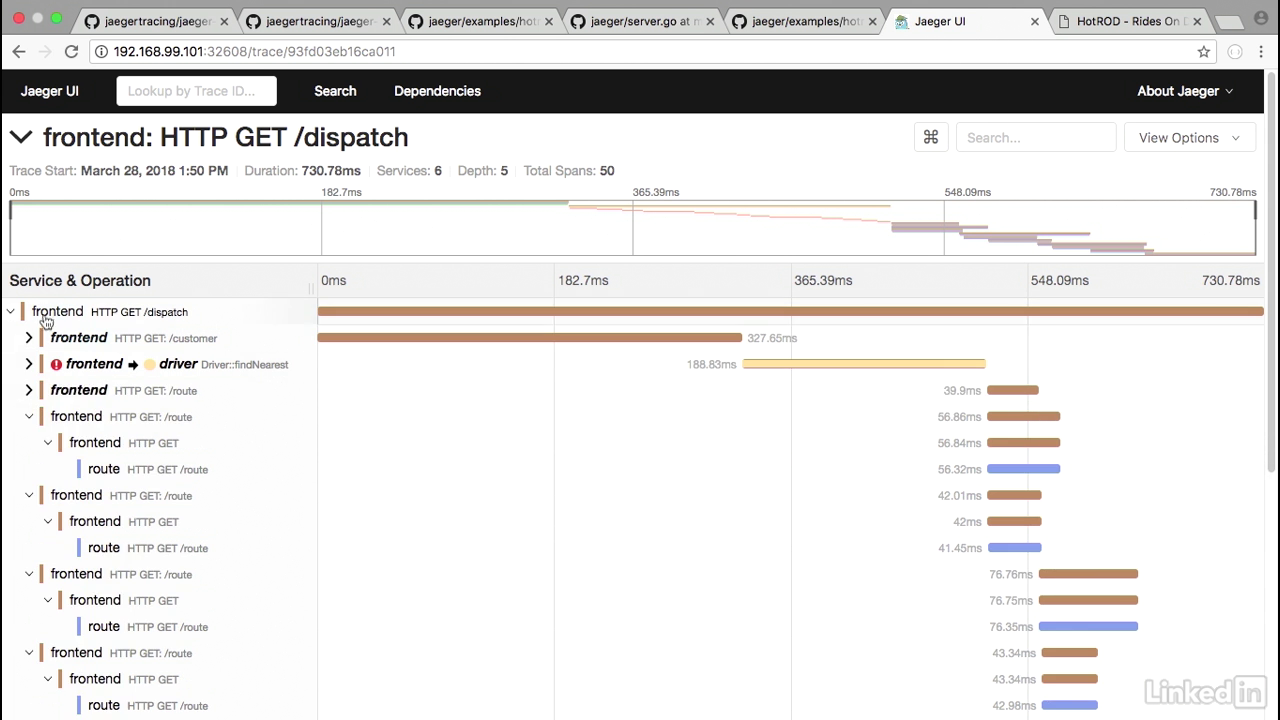
- Click on first group header in cyan
- And the front end basically shows you all of the different HTTP calls that came in.
- So if we look at the dispatch, for example, we can get the logs from it where there's different event streams for customer ID, etc.
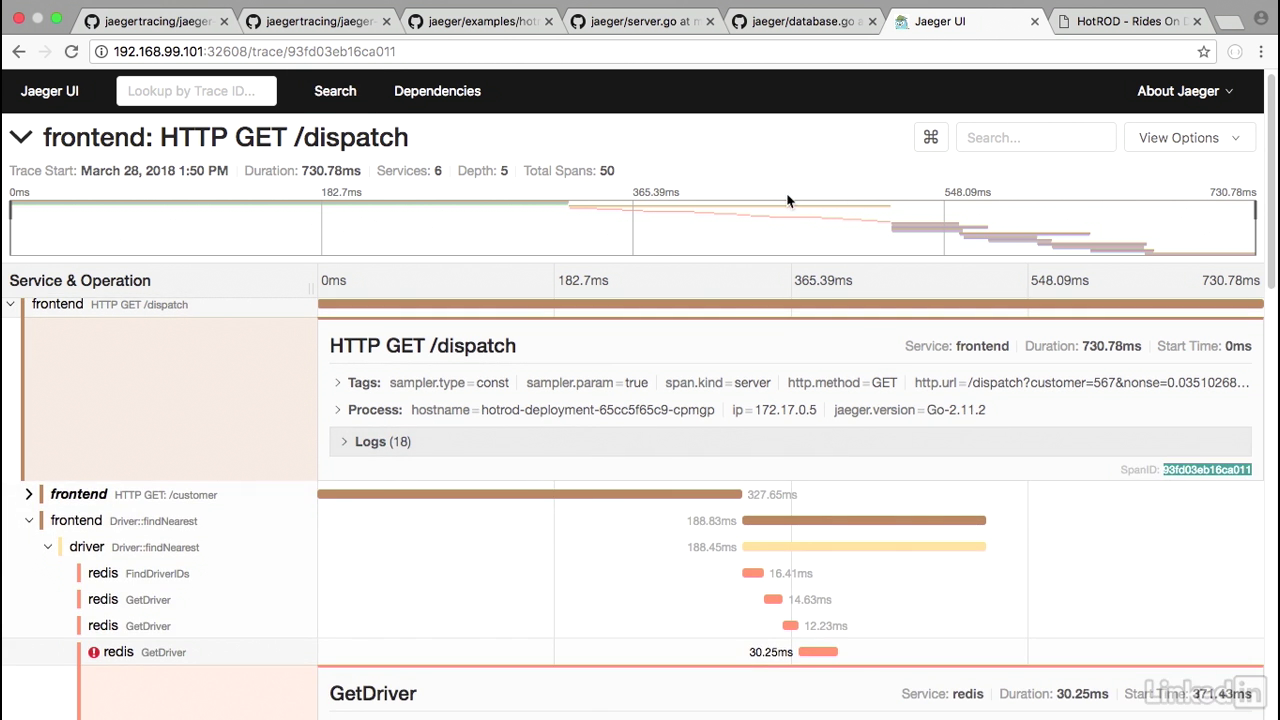
- Or if I drill down into one of these, I can also tell that this specific front end call took 327 milliseconds.
- And to break it down, we can see that the MySQL step on here is the step that took the longest.
Jaeger ui
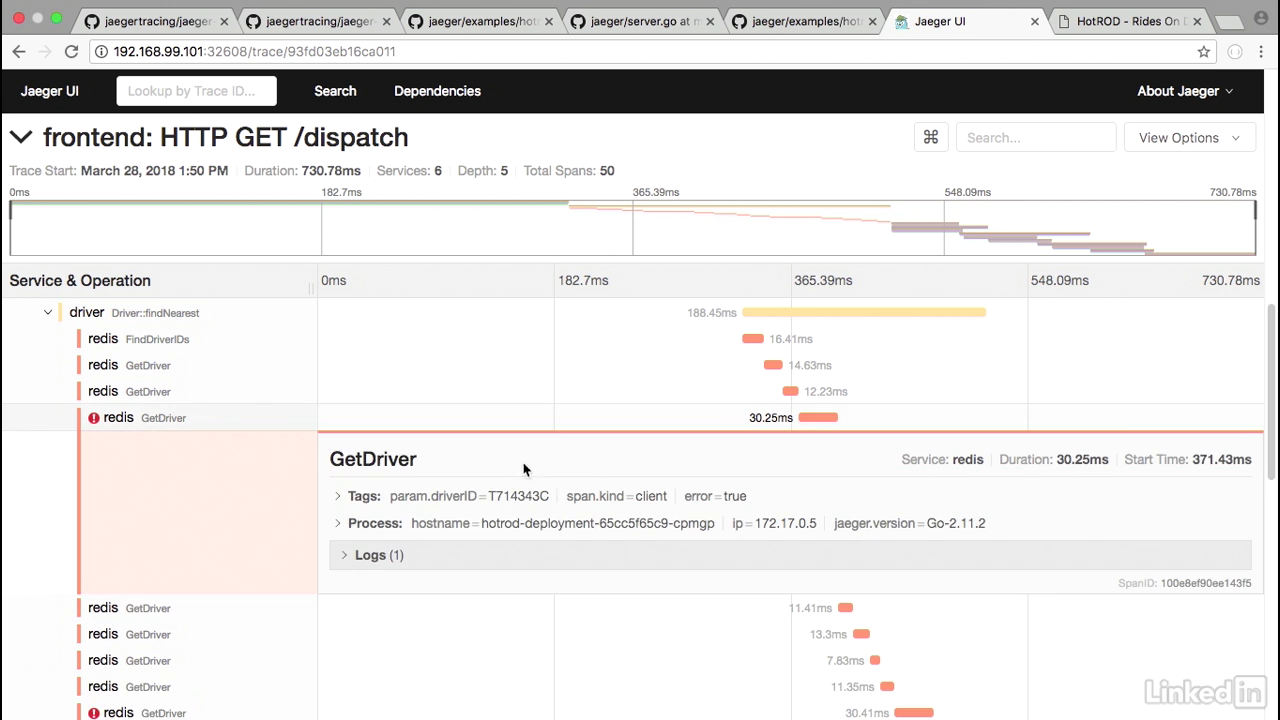
- Let's take a look at another example where we seem to have an error.
- I'm going to drill down, and we'll notice that in this case, there's a lot of calls, the redis GetDriver call seems to have errored for whatever reason, so this is something that we have to go and debug in our application.
- If I look at the logs, notice that the event was a redis timeout, and then it was coming back as an error.
Jaeger ui
- Also, another cool feature is the Dependencies and the dependency graphs.
- It's hard to see from the first screen, but I like the DAG screen a lot more where it shows you the front end, all the different calls to the route, the different calls to the customer, and the different calls to drivers.
- So it helps you understand your application from a holistic point of view.
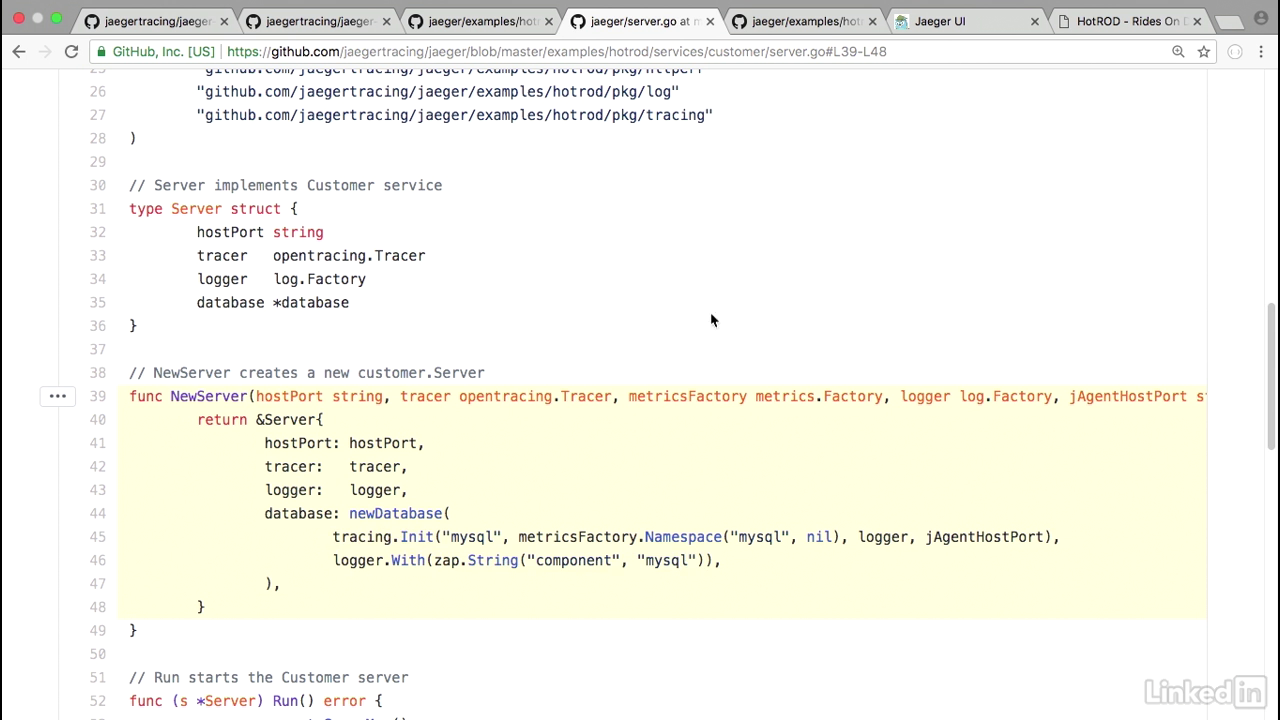
Inside of your application code
- From inside of your application code, there's a couple of things that you need to do.
- If you pull up the application code, for example, the customer screen that we were looking at...
- When you start up your customer in your new server, notice how they have Jaeger tracing initialized, and also the zap's initialized for Jaeger.
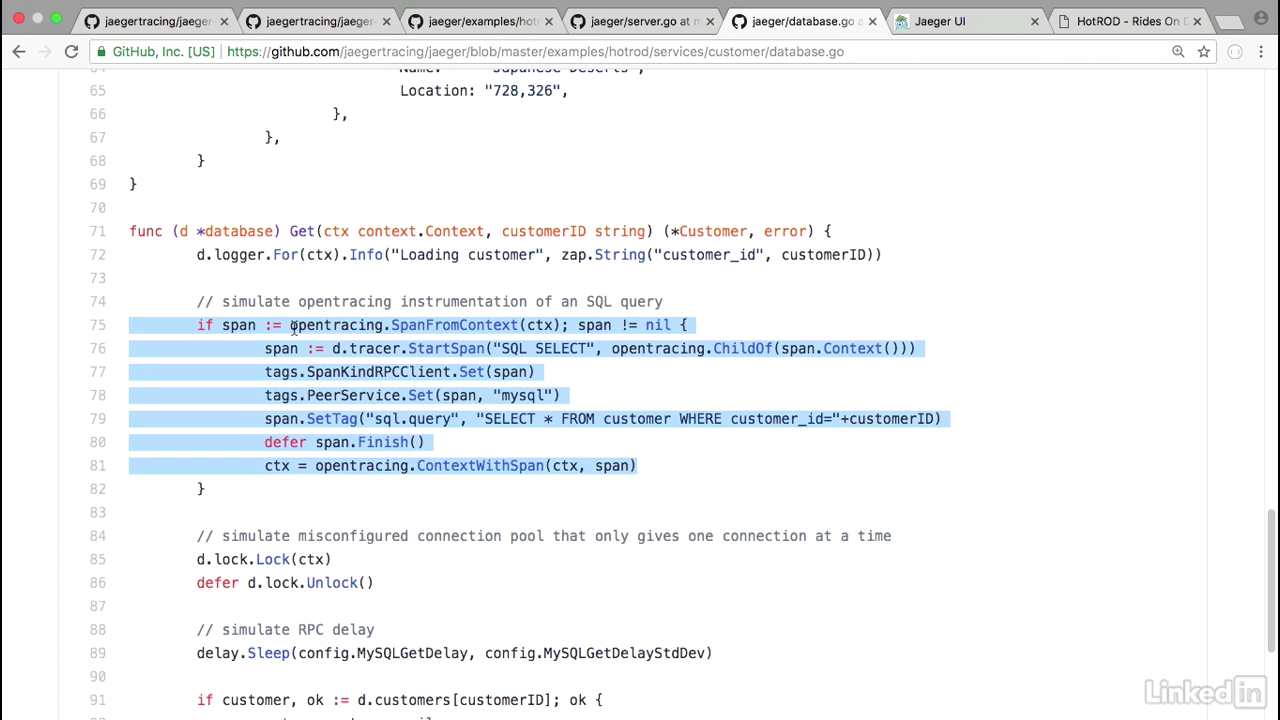
Inside of the service code for the customer
- And inside of the service code for the customer, let's take a look at the database.
- And in our database component, this is where we'll notice that we have spans.
- So we have open tracing, and we have a span from the context.
- And we basically start a span, and finish a span, giving us the timing of the specific call.
50 spans
- And we'll notice that this has 50 spans for the HTTP GET/dispatch.
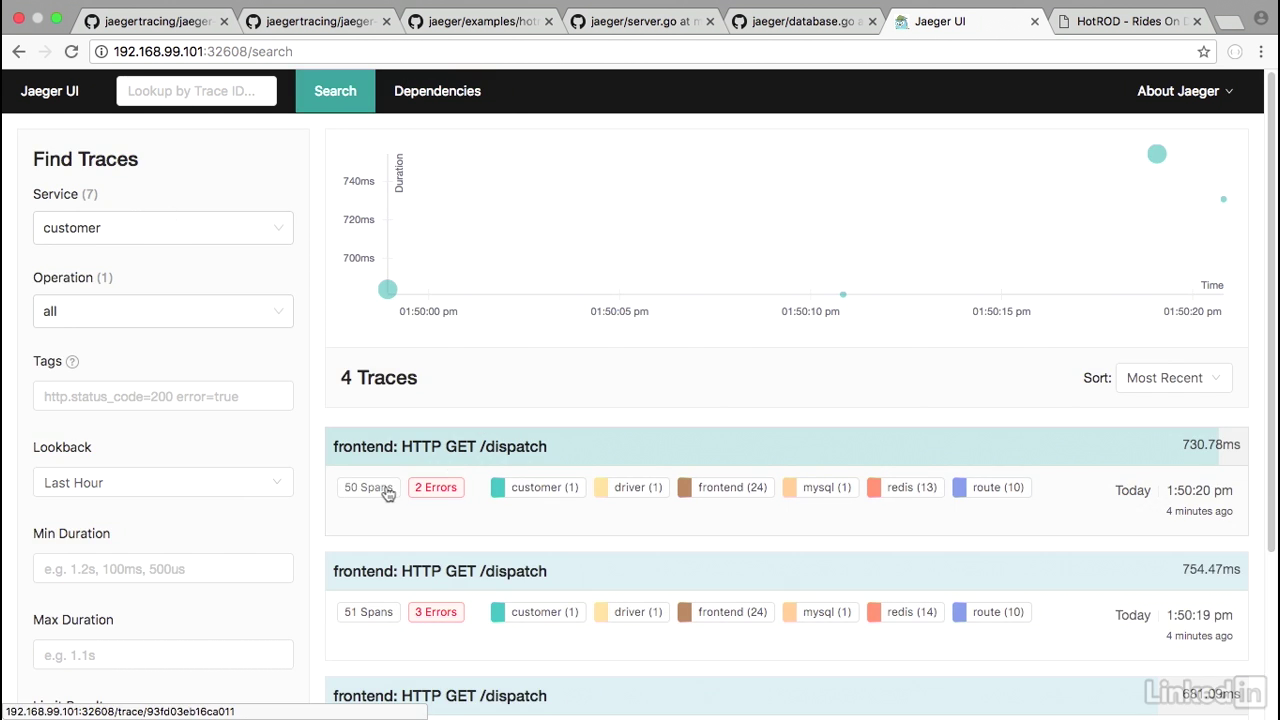
Span detail
- If I click into this, we'll notice that a lot of these end up being spans, and there are span IDs for all of these calls.
- So there we have it.
- This is our application running, and also the application popping up instrumentation into Jaeger that we visualized.
Chapter 06 - Conclusion
Lecture 022 - Next steps
Microservices using Kubernetes
- Microservices using Kubernetes is considered the in thing in the world of Kubernetes, and there's a lot of work going on around microservices.
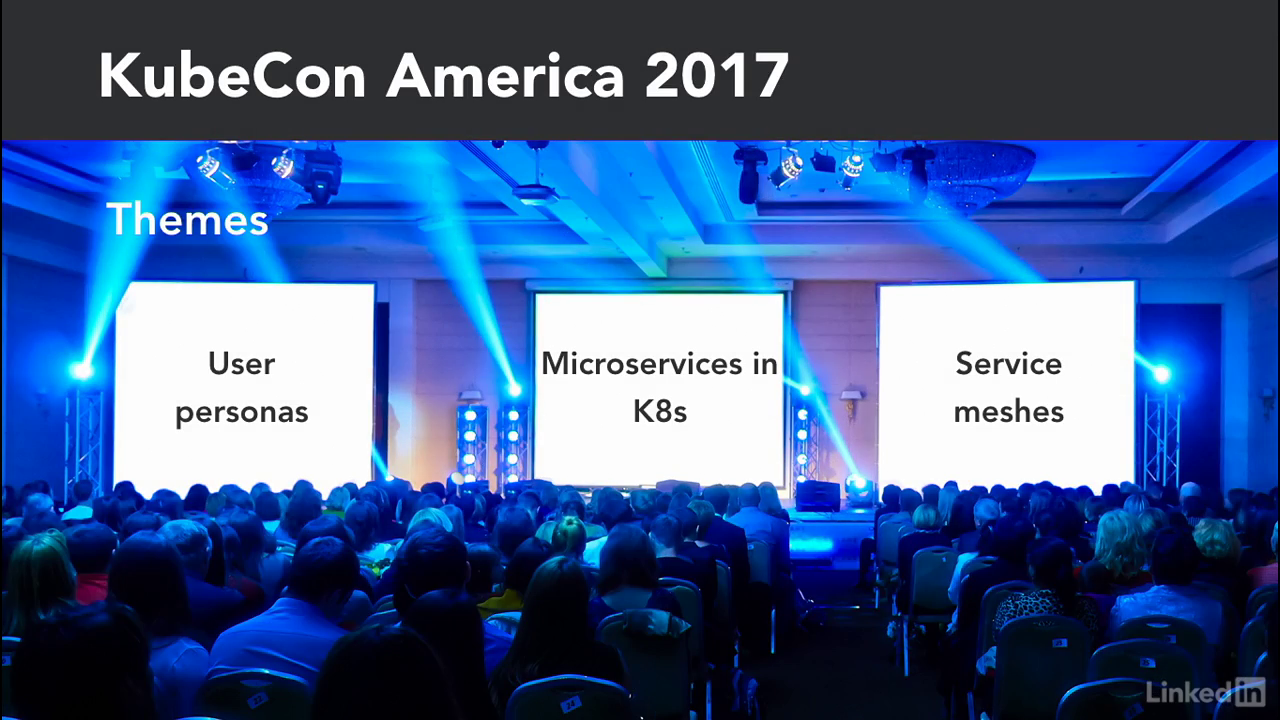
KubeCon American in 2017
- In fact, one of the big themes at KubeCon American in 2017 that happened in December of 2017, were around user personas, microservices, and service meshes.
- It's widely accepted that there are four personas for a typical Kubernetes user.
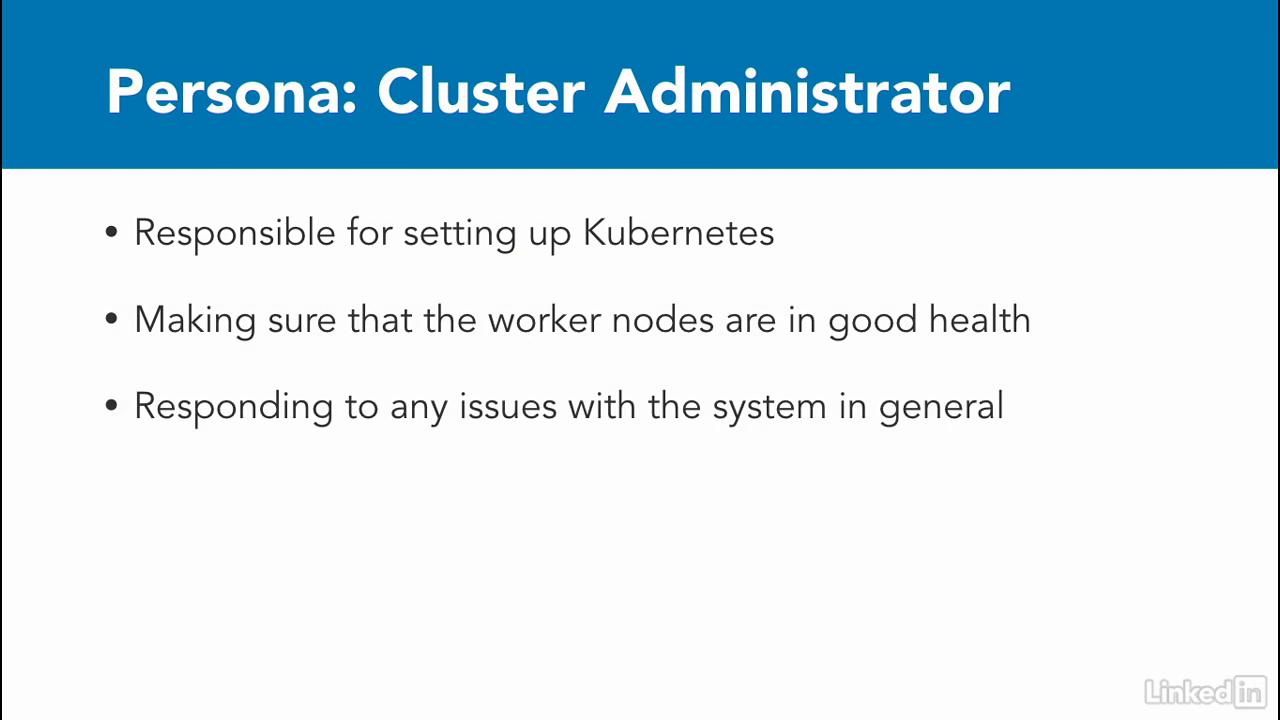
Cluster administrator
- A cluster administrator, who's responsible for setting up Kubernetes, making sure that the Kubernetes worker nodes are in good health, and responding to any issues with the Kubernetes system in general.
Cluster developer
- A cluster developer, who's keeping track and implementing new Kubernetes features and making sure that the existing cluster is adhering to the current specification.
Application administrator
- Next we have the application administrator, who's responsible for making sure that the deployment, services, whatever for the applications are working as expected.
- The administrator might also be the person who architects the microservices for the Kubernetes environment.
- It's probably you who's watching the video right now.
Application developer
- And finally, we have the application developer.
- This person is really just trying to create their applications.
- He or she might be doing all of the things to make sure that the microservices work from a code perspective and adhere to any integration standards set by the app admin.
Service mesh
- Over time, I see the amount of churn in the Kubernetes core code to reduce and the roles of the cluster admin to be a little bit more defined.
- However, this only means that there will be a lot of churn in the rest of the segments and roles.
- Specifically from a microservice perspective, everyone is talking about the service mesh right now.
- The service mesh is basically a dedicated infrastructure layer for handling service to service communication.
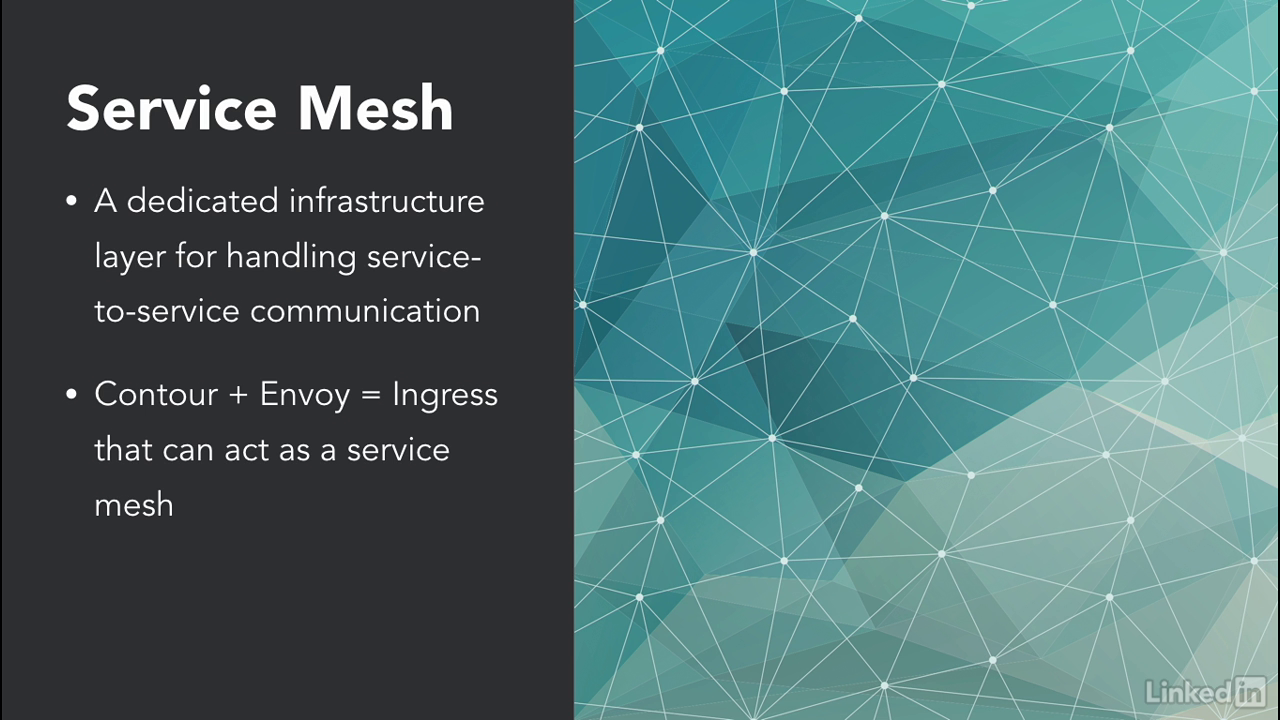
Istio
- We got a glimpse of this with Envoy on Contour in the earlier section, but there's a lot more solutions in this space.
- One technology that everyone is talking about is Istio, which is an opensource platform to connect, manage, and secure microservices.
- Istio is deployed on top of Kubernetes and has a mesh layer in front of all applications and can control traffic handling, policy definition, metrics logs, and security.
- Think of it like the entire advanced chapter we just covered put together in one single solution.
- Application developers actually end up using Istio commands to interact with their cluster instead of kubectl commands.
- It's still young days for Istio, but it's definitely showing a lot of promise.
- But it's yet to be decided if the community will take and run with the platform.
Tips
- Even though we had a simple microservice, we still had a lot of yammle to look at, so get really comfortable with that.
- Also, pay really close attention to labels and selectors, and use these judiciously with your Kubernetes applications.
- It'll save the day for you when you have many many running pods and you're trying to debug problems with your distributor microservice application.
- As always, I wish you the best.
- The nice thing about microservices with Kubernetes is that there are many ways to solve a problem, and it's being built on a pretty solid platform of Kubernetes so you can't go wrong.
So keep calm and kube on